


Ship Data : Deepwater Horizon Support
Ship List
- Gordon Gunter
- Nancy Foster
- Walton Smith
- American Diver
- Arctic
- Brooks McCall
- Bunny Bordelon
- Cape Hatteras
- Delaware II
- Endeavor
- Ferrel
- Gyre
- HOS Davis
- Henry Bigelow
- Jack Fitz
- Meg Skansi
- Ocean Veritas
- Pelican
- Pisces
- Rachel Bordelon
- Ridley Thomas
- Ryan Chouest
- Seward Johnson
- Specialty Diver
- Thomas Jefferson
- Weather Bird II
- Wes Bordelon
Deepwater Horizon data were collected in response to the Deepwater Horizon Oil Spill (MC252 Incident) in the Gulf of Mexico. These data were collated by NODC's coastal data division, the National Coastal Data Development Center (NCDDC), working with NOAA's Office of Response and Restoration (OR&R). NCDDC is the Joint Analysis Group (JAG) Team lead for compiling and processing the data observations made aboard research survey vessels supporting the Subsurface Monitoring Unit (SMU) in the Gulf of Mexico, and helped define the data collection procedures. The Subsurface Monitoring Unit (SMU) consisted of government, academic and private researchers and support staff tasked with the detection, monitoring, sampling and assessment of the Deepwater Horizon Oil Spill. The data are permanently archived at NODC headquarters in Silver Spring, MD. Along with NODC's Ocean Climate Laboratory, NCDDC contributed data analysis to JAG reports which can be found on the JAG website.
The data are available below in both unprocessed (raw) and processed formats for each cruise. The data include chemical, physical and profile observations and laboratory analysis results including on-shore screening for total petroleum hydrocarbons, dispersant, volatile organic compounds and semi-volatile organic compounds.
The Global Temperature and Salinity Profile Programme (GTSPP) compiled data from the GTSPP master data base maintained by NODC. The data are available in three commonly used formats, namely CSV (comma separated value), netCDF (network Common Data Form) and GTSPP ASCII formats (format description). An inventory file and plots of each vertical profile are also available. Lastly, a Keyhole Markup Language file (in KMZ format) is available for Google Earth and Google Maps display.
Ship Instrument Definitions
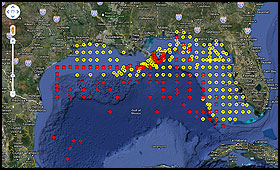
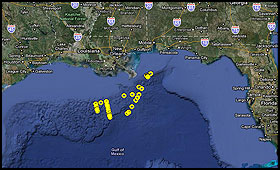
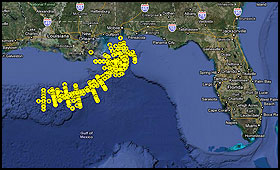
Gordon Gunter Observations
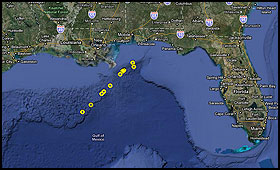
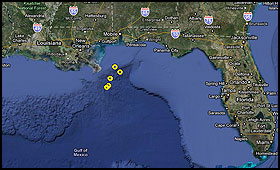
Water temperature and salinity data were collected by the NOAA Ship Gordon Gunter in response to the Deepwater Horizon oil spill incident on April 20, 2010.
GTSPP DATA
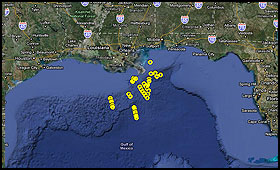
Gordon Gunter collected 86 profiles of salinity and 107 profiles of temperature (193 total) using 21 XBT's and 86 CTD's from April 22 - May 30, 2010:
Plots, CSV, NetCDF, GTSPP ASCII, Inventory, Google Earth .kmz
Subsurface Oil Monitoring Data
Air Temperature, Barometric Pressure, Biological Data, CDOM Fluorescence, Chlorophyll, Conductivity, Continuous Temperature, Current Speed - East/west Component (u), Current Speed - North/south Component (v), Depth - Bottom, Dissolved Oxygen, Fluorescence, Hydrostatic Pressure, Optical, Relative Humidity, Salinity, Salinity - Surface Water, Sea State, Sea Surface Temperature, Secchi, Secchi Depth, Semivolatile Organic Compounds, Sound Velocity, Temperature, Total Petroleum Hydrocarbons (TPH), Volatile Organic Compounds, Water Clarity, Water Density, Wind Direction, Wind Speed
| Cruise 01: | About | ADCP | Cruise Documents | CTD | Products | XBT |
| Cruise 02: | About | ADCP | Cruise Documents | CTD | Products |
| Cruise 03: | About | ADCP | Cruise Documents | CTD | Products |
| Cruise 04: | About | ADCP | Cruise Documents | CTD | Products |
| Cruise 05: | About | ADCP | Cruise Documents | Products |
| Cruise 06: | About | Cruise Documents | CTD | Products |
| Cruise 07: | About | ADCP | Analytical Chemistry | Cruise Documents | CTD | Products |
| Cruise 08: | About | Cruise Documents | CTD | Products | SCS |
| Cruise 09: | About | ADCP | Cruise Documents | CTD | Products | SCS |
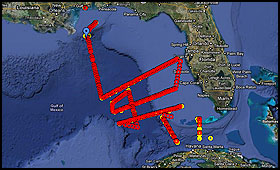
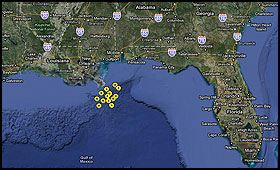
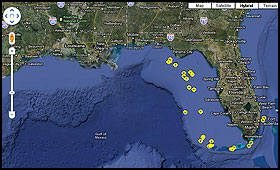
Nancy Foster Observations
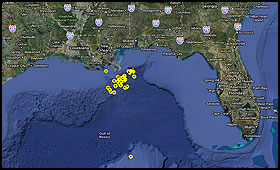
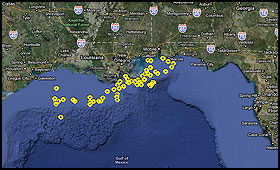
Water temperature and salinity data were collected by the NOAA Ship Nancy Foster in response to the Deepwater Horizon oil spill incident on April 20, 2010.
GTSPP DATA
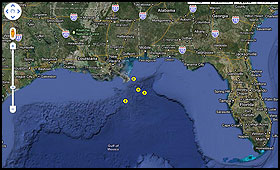
Nancy Foster collected 25 profiles of salinity and 210 profiles of temperature (235 total) using 185 XBT's and 25 CTD's from July 1 - July 18, 2010:
Plots, CSV, NetCDF, GTSPP ASCII, Inventory, Google Earth .kmz
Subsurface Oil Monitoring Data
Air Temperature, Barometric Pressure, CDOM Fluorescence, Conductivity, Current Speed - East/west Component (u), Current Speed - North/south Component (v), Dissolved Oxygen, Fluorescence, Hydrostatic Pressure, Plankton, Relative Humidity, Salinity, Salinity - Surface Water, Sea Surface Temperature, Semivolatile Organic Compounds, Sound Velocity, Temperature, Total Petroleum Hydrocarbons (TPH), Volatile Organic Compounds, Water Density, Wind Direction, Wind Speed
| Cruise 01: | About | ADCP | Analytical Chemistry | Cruise Documents | CTD | LADCP | MOCNESS | SCS | TSG | XBT |
| Cruise 03: | About | CTD |
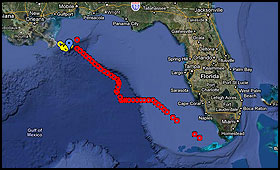
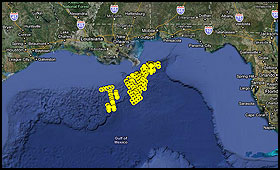
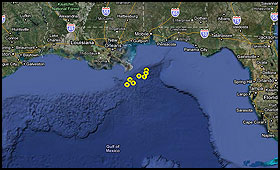
Walton Smith Observations
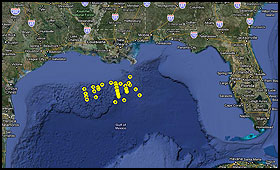
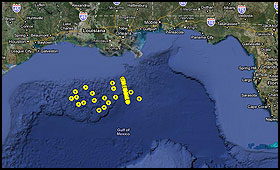
Water temperature data was collected by the the research vessel F. G. Walton Smith in response to the Deepwater Horizon oil spill incident on April 20, 2010.
GTSPP DATA
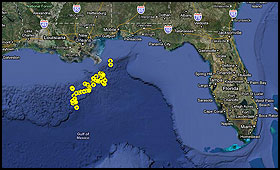
Walton Smith collected 41 profiles of temperature using 41 XBT's from June 7 - June 10, 2010:
Plots, CSV, NetCDF, GTSPP ASCII, Inventory, Google Earth .kmz
Subsurface Oil Monitoring Data
CDOM Fluorescence, Conductivity, Dissolved Oxygen, Hydrostatic Pressure, Salinity, Sound Velocity, Temperature, Volatile Organic Compounds, Water Density
| Cruise 01: | About | Analytical Chemistry | Cruise Documents | CTD | Products |
| Cruise 02: | About | Cruise Documents | CTD | Products |
American Diver Observations
Subsurface Oil Monitoring Data
CDOM Fluorescence, Conductivity, Dissolved Oxygen, Hydrostatic Pressure, Salinity, Sound Velocity, Temperature, Water Density
| Cruise 01: | About | CTD |
Arctic Observations
Subsurface Oil Monitoring Data
CDOM Fluorescence, Conductivity, Dissolved Oxygen, Hydrostatic Pressure, Salinity, Sound Velocity, Temperature, Water Density
| Cruise CR3: | About | CTD |
Brooks McCall Observations
Subsurface Oil Monitoring Data
Attenuation/Transmission, CDOM Fluorescence, Conductivity, Dissolved Oxygen, Fluorescence, Hydrostatic Pressure, Salinity, Semivolatile Organic Compounds, Sound Velocity, Suspended Solids, Temperature, Total Petroleum Hydrocarbons (TPH), Turbidity, Volatile Organic Compounds, Water Density
Bunny Bordelon Observations
Subsurface Oil Monitoring Data
CDOM Fluorescence, Conductivity, Dissolved Oxygen, Hydrostatic Pressure, Salinity, Semivolatile Organic Compounds, Sound Velocity, Temperature, Total Petroleum Hydrocarbons (TPH), Volatile Organic Compounds, Water Density
| Cruise 01: | About | CTD |
| Cruise CR3: | About | CTD |
| Cruise CS1: | About | Analytical Chemistry | CTD |
Cape Hatteras Observations
Subsurface Oil Monitoring Data
CDOM Fluorescence, Conductivity, Dissolved Oxygen, Fluorescence, Hydrostatic Pressure, Salinity, Sound Velocity, Temperature, Water Density
| Cruise 01: | About | Cruise Documents | CTD |
| Cruise 02: | About | Cruise Documents | CTD |
Delaware II Observations
Subsurface Oil Monitoring Data
Temperature
| Cruise 01: | About | Cruise Documents | CTD |
| Cruise 02: | About | Cruise Documents |
Endeavor Observations
Ferrel Observations
Subsurface Oil Monitoring Data
CDOM Fluorescence, Conductivity, Dissolved Oxygen, Hydrostatic Pressure, Salinity, Semivolatile Organic Compounds, Sound Velocity, Temperature, Total Petroleum Hydrocarbons (TPH), Volatile Organic Compounds, Water Density
| Cruise 01: | About | Analytical Chemistry | Cruise Documents | Products |
| Cruise 02: | About | Analytical Chemistry | Cruise Documents | CTD | Products |
| Cruise 03: | About | Analytical Chemistry | Cruise Documents | CTD | Products |
| Cruise 04: | About | Analytical Chemistry | Cruise Documents | CTD |
| Cruise 05: | About | Analytical Chemistry | Cruise Documents | CTD | Products |
| Cruise 06: | About | Analytical Chemistry | Cruise Documents | CTD | Products |
| Cruise 07: | About | Analytical Chemistry | Cruise Documents | CTD | Products |
| Cruise 08: | About | Analytical Chemistry | Cruise Documents | CTD | Products |
Gyre Observations
Subsurface Oil Monitoring Data
CDOM Fluorescence, Carbon - Total Organic, Conductivity, Dissolved Oxygen, Hydrostatic Pressure, Metals, Salinity, Sediment Properties, Semivolatile Organic Compounds, Sound Velocity, Temperature, Total Petroleum Hydrocarbons (TPH), Volatile Organic Compounds, Water Density
| Cruise 01: | About | Cruise Documents | Sediment |
| Cruise 02: | About | Analytical Chemistry | Cruise Documents | Sediment |
| Cruise 03: | About | Analytical Chemistry | Cruise Documents | Sediment |
| Cruise 04: | About | Analytical Chemistry | Cruise Documents | Sediment |
| Cruise 05: | About | Analytical Chemistry | Cruise Documents | CTD | Products | Sediment |
HOS Davis Observations
Subsurface Oil Monitoring Data
CDOM Fluorescence, Conductivity, Dissolved Oxygen, Fluorescence, Hydrostatic Pressure, Salinity, Sound Velocity, Temperature, Water Density
| Cruise 01: | About | CTD |
| Cruise HD2: | About | CTD |
| Cruise HD3: | About | CTD |
Henry Bigelow Observations
Subsurface Oil Monitoring Data
CDOM Fluorescence, Conductivity, Dissolved Oxygen, Hydrostatic Pressure, Salinity, Sound Velocity, Temperature, Water Density
| Cruise 01: | About | Cruise Documents | CTD |
| Cruise 02: | About | Cruise Documents | CTD | Products |
Jack Fitz Observations
Subsurface Oil Monitoring Data
CDOM Fluorescence, Conductivity, Dissolved Oxygen, Fluorescence, Hydrostatic Pressure, Salinity, Semivolatile Organic Compounds, Sound Velocity, Temperature, Total Petroleum Hydrocarbons (TPH), Volatile Organic Compounds, Water Density
| Cruise 01: | About | CTD |
| Cruise 02: | About | CTD |
| Cruise 03: | About | Analytical Chemistry | CTD |
| Cruise CR3: | About | CTD |
| Cruise CS1: | About | Analytical Chemistry | CTD |
Meg Skansi Observations
Subsurface Oil Monitoring Data
CDOM Fluorescence, Conductivity, Dissolved Oxygen, Hydrostatic Pressure, Salinity, Sound Velocity, Temperature, Water Density
| Cruise CR3: | About | CTD |
Ocean Veritas Observations
Subsurface Oil Monitoring Data
Attenuation/Transmission, CDOM Fluorescence, Carbon - Total Organic, Conductivity, Dissolved Oxygen, Hydrostatic Pressure, Metals, Salinity, Sediment Properties, Semivolatile Organic Compounds, Sound Velocity, Suspended Solids, Temperature, Total Petroleum Hydrocarbons (TPH), Volatile Organic Compounds, Water Density
Pelican Observations
Subsurface Oil Monitoring Data
CDOM Fluorescence, Conductivity, Dissolved Oxygen, Hydrostatic Pressure, Salinity, Sound Velocity, Temperature, Water Density
| Cruise 01: | About | Cruise Documents | CTD |
Pisces Observations
Subsurface Oil Monitoring Data
CDOM Fluorescence, Conductivity, Dissolved Oxygen, Fluorescence, Hydrostatic Pressure, Salinity, Sediment Properties, Sound Velocity, Temperature, Turbidity, Water Density
| Cruise 01: | About | Cruise Documents | Products |
| Cruise 02: | About | Cruise Documents | Products |
| Cruise 03: | About | Cruise Documents | CTD |
| Cruise 04: | About | Cruise Documents | CTD |
| Cruise 05: | About | Cruise Documents | CTD |
| Cruise 06: | About | Cruise Documents | CTD | Products | Sediment | Tow Cam CTD |
Rachel Bordelon Observations
Subsurface Oil Monitoring Data
CDOM Fluorescence, Conductivity, Dissolved Oxygen, Hydrostatic Pressure, Salinity, Sound Velocity, Temperature, Water Density
| Cruise CR3: | About | CTD |
Ridley Thomas Observations
Ryan Chouest Observations
Subsurface Oil Monitoring Data
CDOM Fluorescence, Carbon - Total Organic, Conductivity, Dissolved Oxygen, Fluorescence, Hydrostatic Pressure, Metals, Methane, Salinity, Sediment Properties, Semivolatile Organic Compounds, Sound Velocity, Temperature, Total Petroleum Hydrocarbons (TPH), Volatile Organic Compounds, Water Density
Seward Johnson Observations
Subsurface Oil Monitoring Data
CDOM Fluorescence, Conductivity, Dissolved Oxygen, Fluorescence, Hydrostatic Pressure, Salinity, Sound Velocity, Temperature, Water Density
| Cruise 01: | About | CTD |
| Cruise 02: | About | CTD |
| Cruise 03: | About | CTD |
| Cruise 04: | About | CTD |
Specialty Diver Observations
Subsurface Oil Monitoring Data
Conductivity, Dissolved Oxygen, Fluorescence, Hydrostatic Pressure, Salinity, Sound Velocity, Temperature, Water Density
| Cruise 01: | About | CTD |
Thomas Jefferson Observations
Subsurface Oil Monitoring Data
CDOM Fluorescence, Conductivity, Dissolved Oxygen, Fluorescence, Hydrostatic Pressure, Salinity, Sound Velocity, Temperature, Water Density
| Cruise 01: | About | Cruise Documents | Products |
| Cruise 02: | About | Cruise Documents | CTD | MVP | Products |
| Cruise 03: | About | Cruise Documents | CTD |
Weather Bird II Observations
Wes Bordelon Observations
Subsurface Oil Monitoring Data
CDOM Fluorescence, Conductivity, Dissolved Oxygen, Hydrostatic Pressure, Salinity, Semivolatile Organic Compounds, Sound Velocity, Temperature, Total Petroleum Hydrocarbons (TPH), Volatile Organic Compounds, Water Density
| Cruise 01: | About | Analytical Chemistry |
| Cruise CR3: | About | CTD |
| Cruise CS1: | About | CTD |
Definitions
Ship Instruments
What is a CTD? A Conductivity-Temperature-Depth (CTD) is an ocean instrument that has a combination of a pressure sensor (measured pressure is converted to depth), a resistance temperature measurement device (usually a platinum thermometer), and a conductivity sensor used to estimate salinity. CTDs are usually mounted on a metal frame and lowered through the water column suspended from a cable. Example CTD Plot.
What is an XBT? An eXpendable BathyThermograph (XBT) is a probe that is dropped from a ship and measures the water temperature as it falls. A very thin wire transmits the temperature data to the ship where it is recorded for later analysis. The probe is designed to fall at a known rate, so that the depth of the probe can be inferred from the time lapsed from launch.
What are ADCP/LADCP? The Acoustic Doppler Current Profiler (ADCP) measures currents beneath a ship while under way. Sound signals sent from the moving ship bounce back to receivers aboard the ship. This provides a profile of water movement relative to the ship-precise modern navigation, allowing the ship's motion to be subtracted from the data. These devices are also used on moorings and profilers and, along with acoustic backscattering, measure animal biomass. Particles in the path of the sound waves, mostly plankton, reflect a small part of the sound energy back toward receivers, allowing researchers to make remote estimates of the sizes and numbers of animals present in the water column. The Lowered Acoustic Doppler Current Profiler (LADCP) is an ADCP which can be lowered on a cable from the surface.
What is a Hydrocarbon Sensor Array? The Hydrocarbon Sensor Array is a sensor platform developed by the Commonwealth Scientific and Industrial Research Organisation (CSIRO), Australia's national science agency, for detecting different types of hydrocarbons at varying sensitivities, and in real time. The platform consists of a number of hydrocarbon sensors assembled to produce a highly sensitive and discriminatory hydrocarbon sensor capability designed to detect and differentiate hydrocarbons in a marine environment. The platform enables environmental monitoring, studying of ocean changes and the measurement of human impacts on marine environments.
What is a LISST? A Laser In Situ Scattering and Transmissometer (LISST) measures the size distribution of particles 5 to 250 microns in diameter. LISST generates diagrams of the size distribution of particles and small aggregates in the water column without disturbing them by collecting them in water bottles. Particles' sizes influence their optical properties and settling dynamics, but many of the aggregates fall apart in water bottles before they can be returned to the lab and measured.
What is a MOCNESS? A Multiple Opening/Closing Net and Environmental Sensing System (MOCNESS) is a net system for measuring plankton in the ocean. The MOCNESS is towed behind a research vessel at low speed and consists of numerous nets of varying mesh sizes. Each net can be opened and shut independently so that it samples a discrete patch of water. The net enables biologists to catch zooplankton and nekton in various depth horizons typically anywhere in the upper 500 m of the oceans. There is also an array of sensors mounted on the instrument frame that relays water conditions up to the ship in real time, typically including CTD, PAR (photosynthetically available light), transmissometry and fluorescence sensors. The sensor data help researchers match what they find in their samples to the physical properties of the seawater.
What is a MVP? The Moving Vessel Profiler (MVP) is a multi-purpose instrument for aiding in the collection of both shallow and deep water data sets. The MVP's primary function is to allow accurate data collection without the need to stop the vessel. The system includes a smart winch and deployment system which is completely autonomous and can be controlled by computer without the requirement for personnel on deck. Sensors that have been used with the MVP system include sound velocity, CTD, Laser Optical Particle Counter (LOPC) and fluorometer.
What is a SCS? The Shipboard Computer System (SCS) is a system that collects, processes, displays and stores data from the navigational and scientific sensors on NOAA ships. NOAA developed this system to modernize and standardize data collection on its primary ocean and coastal research vessels. The number and type of sensors vary according to each ship and its particular mission, but they commonly include oceanographic, atmospheric, navigational, and fisheries data instruments. Selected data from the SCS are sent electronically to NOAA data centers where they are integrated in weather and sea-state forecasts, and archived for distribution to the public.
What is a TSG? A Thermo-Salino-Graph (TSG) is an automated sea surface measurement system making measurement on board the ship using a water intake. A conductivity cell and a thermistor cell provide conductivity and temperature measurements. Salinity is derived from conductivity and temperature.
 Offsite Link Notification