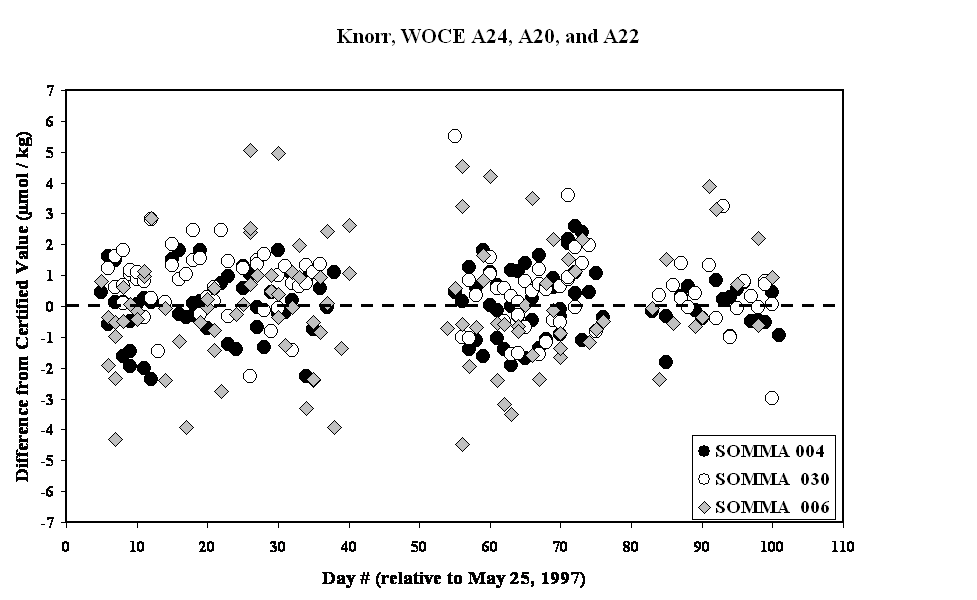
Figure 3

Fig. 3. The temporal distribution of differences among the measured and certified TCO2 for CRM analyzed on SOMMA-coulometry systems 004 (closed circles) and 030 (open circles), and 006 (shaded diamonds) during the WOCE North Atlantic Sections A24, A20, and A22 in 1997.
Last modified: 2021-03-17T18:30:28Z
