Figure 4

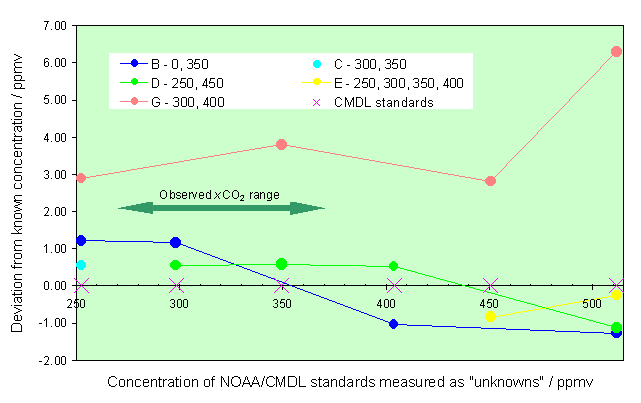
Fig. 4. Results from the check of the CO2 calibration performance: Shown are the observed deviations from the concentrations of all measured NOAA/CMDL CO2 standards. Pink crosses indicate the concentrations of the standards used in the exercise. The legend gives details of the nominal concentrations used for calibration. Also shown is the range of measured xCO2 during the whole intercomparison.
Last modified: 2021-03-17T18:30:27Z
