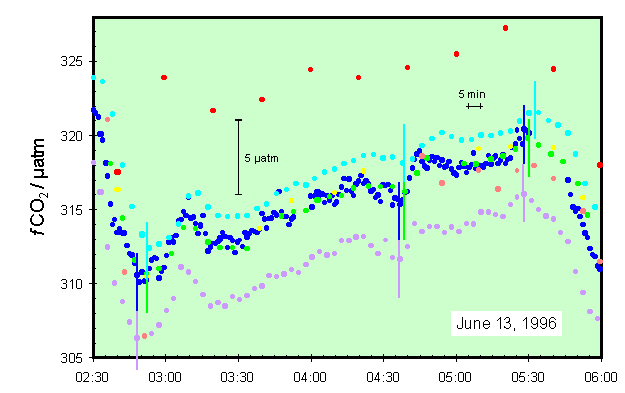
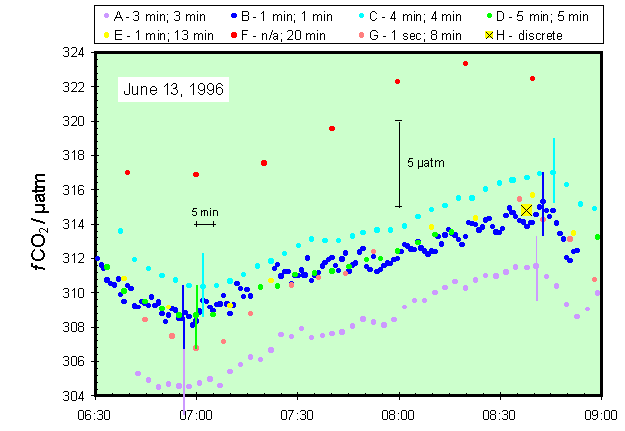
Figure 23


Fig. 23. Comparison of fCO2 data measured during two periods on June 13, 1996: (top) 3.5 h and (bottom) 2.5 h. Vertical lines indicate approximate relative maxima and minima observed in the fCO2 profiles. The legend includes the averaging and reporting intervals of all systems.
Last modified: 2021-03-17T18:30:27Z
