Figure 22

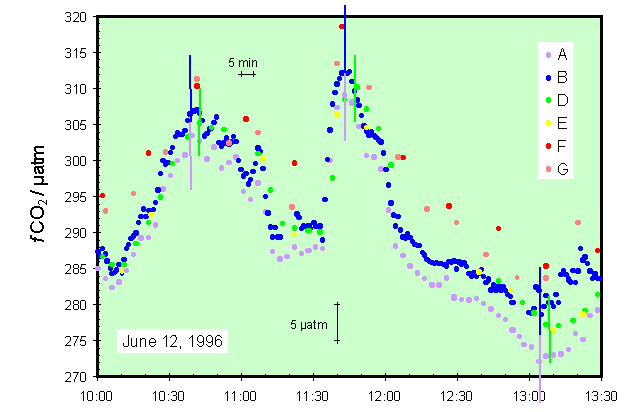
Fig. 22. Comparison of fCO2 data measured during a 3.5-hour period on June 12 (no data available for "C" and "E"). Vertical lines indicate approximate relative maxima and minima observed in the fCO2 profiles.
Last modified: 2021-03-17T18:30:27Z
