Figure 13


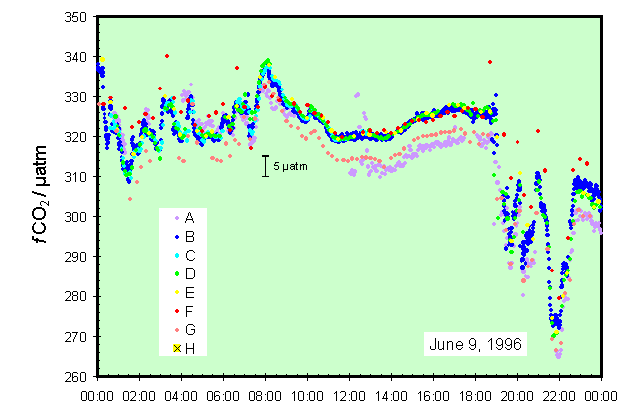
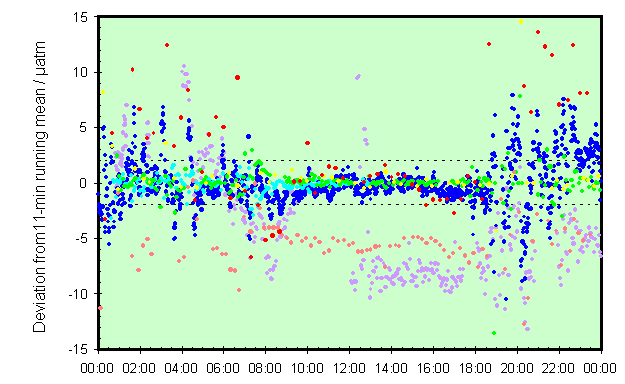
Fig. 13. June 9, 1996, fCO2 data collected by R/V Meteor Cruise 36/1 in the North Atlantic: (top) underway ("A" through "G") and discrete ("H") data; (bottom) deviation of all fCO2 measurements ("A" through "H") from an 11-minute running mean calculated from profiles "C," "D," and "E." The bottom graph also shows the ±2-µatm deviation range.
Last modified: 2021-03-17T18:30:27Z
