Figure 4

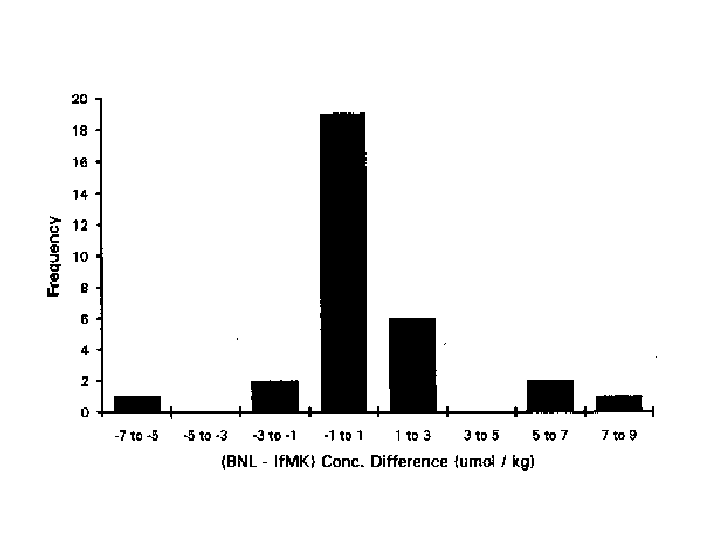
Fig. 4. A histogram showing the frequency and distribution of the magnitude of the differences for 31 samples for which aliquots were analyzed on both measurement systems (BNL and IfMK) during R/V Meteor Cruise 22/5.
Last modified: 2021-03-17T18:30:27Z
