Technical Data Report: Shipboard Titration Alkalinity Measurements on TUNES Leg 3 (WOCE Line P16C) in September, 1991
Guenther, P. R., G. Emanuele III, D. J. Moss, T. J. Lueker, and C. D. Keeling.
I. Cruise Summary
Shipboard measurements of CO2 system parameters in sea water were made on TUNES Leg 3 cruise of the Scripps Institution of Oceanography (SIO) on the R/V Thomas Washington. The Chief Scientist was Dr. Lynne Talley of SIO. The cruise leg, along approximately 151oW longitude between Papeete, Tahiti and Honolulu, Hawaii, was designated Line P16C of the one - time survey of the World Ocean Circulation Experiment (WOCE). CO2 system measurements on this cruise were a joint effort of Woods Hole Oceanographic Institution (WHOI) (Dr. Catherine Goyet, Principal Investigator) and the Carbon Dioxide Research Group (CDRG) of SIO (Dr. Charles Keeling, Principal Investigator). WHOI was responsible for measurements of Total Dissolved Inorganic Carbon (DIC) with a SOMMA coulometric titrator. The analyst was Dr. Edward Peltzer of WHOI. SIO was responsible for measurements of Titration (or "Total") Alkalinity (ALK) with a potentiometric acid titration system. The analyst was Mr. Peter Guenther of SIO.
II. Shipboard Water Sampling Program
Samples for shipboard analysis of DIC and ALK were collected from 10 liter Niskin bottles on the 36 position small volume rosette water sampling system. A total of 700 Niskins were sampled from 21 stations between 17oS and 17oN latitude.
Samples were collected by established procedures (DOE,1994) in 500 ml borosilicate glass bottles equipped with Rodaviss joint closure systems. Single samples were collected from all Niskins except for a small number sampled in duplicate. All samples were collected by the two CO2 analysts or by one analyst with the assistance of a marine/ computer technician, Mr. George Bouchard of SIO. The two persons worked as a team during sample collection. One person filled the bottles from the Niskins and one of the two analysts adjusted the water volume, added the mercuric chloride poison and prepared and sealed the bottle joints. Additionally, replicate samples for shore based analyses of DIC and ALK were collected in duplicate from 106 of the 700 Niskins.
Analyses of DIC and ALK were performed on aliquots of water subsampled from the same bottle of water. Single aliquots for DIC analysis were removed from the bottles first. Aliquots for ALK analysis were later removed from the same bottles. Enough water was available to perform at least two ALK titrations.
III. Alkalinity Measurement Summary
Of the total of 700 Niskins sampled, 552 were titrated to determine ALK. Typically 28 of the total of 36 samples collected on a station were analyzed for ALK. Duplicate samples from Niskins were collected on six stations and analyzed for ALK. For quality assessment purposes, 80 titrations were performed on 43 bottles of the bicarbonate Certified DIC Reference Material Batch No. 6 and 80 more titrations were performed on 24 bottles of bicarbonate reference material solutions prepared at SIO. A total of 736 individual titrations were performed over 27 days during the cruise leg.
IV. Description of Analytical System and Procedures
A. Overall system description
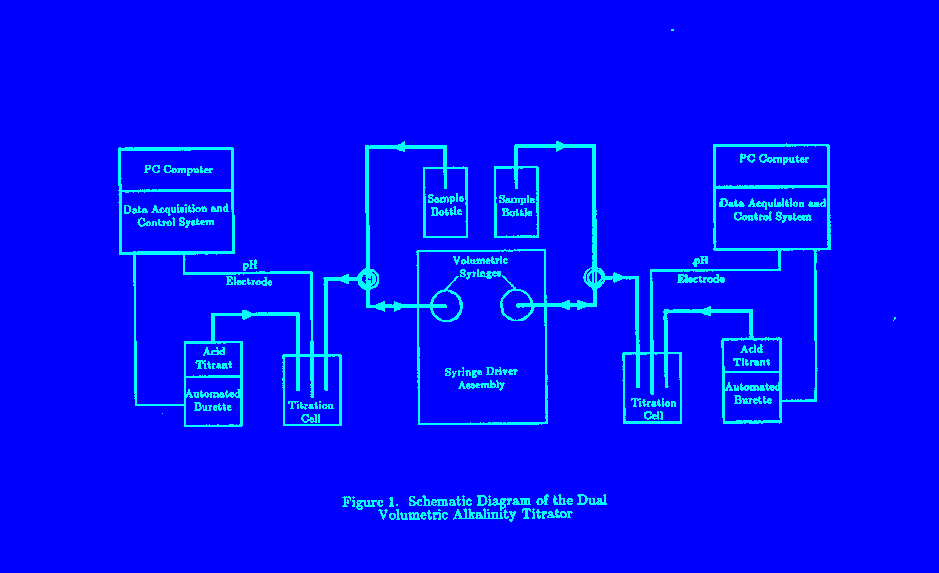
The closed cell potentiometric acid titration system was designed and constructed at SIO by David Moss with the developmental and experimental assistance of Timothy Lueker. Figure 1 is a schematic diagram of the analytical system. It differs from other alkalinity titration systems in the method employed to define the volume of seawater to be titrated. This was accomplished by dispensing simultaneously constant volumes of water from two syringes into two titration cells so that two titrations could be run at the same time. Between titrations the cells were rinsed with purified water to remove all traces of acid or alkalinity from the cell. The cell volumes, after filling with water, were adjusted using a bladder to minimize the air space. This scheme eliminated the need to determine and control the cell volume. It added the requirement of calibrating and controlling the delivery of constant volumes by the syringe system. Calibration was readily monitored at sea by delivering samples into pre - weighed septum bottles for later weighing at the shore laboratory.
After the titration cell had been filled and adjusted, the analytical procedures were typical of those used by other investigators. Acid doses were added using an automated burette and the resultant EMF recorded, all under computer control. All of the titration points were fit to a model of the system using a non - linear least squares approach. The alkalinity that minimized the residuals of this fit was found.
Details of the several main parts of the system and operating procedures follow.
B. Titration cell
1. Description of cell components
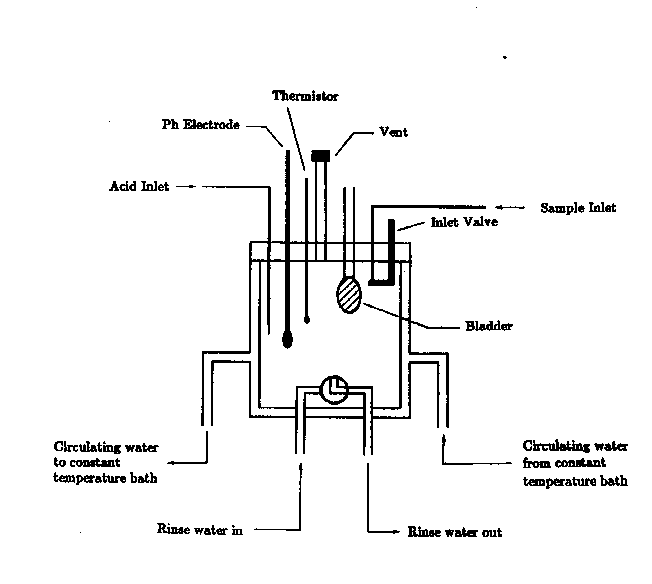
Figure 2 is a schematic diagram of the titration cell. The cell bottom is a borosilicate glass Sybron/Brinkmann "90 ml" size water jacketed cell, modified by a glassblower to include a drain outlet equipped with a Teflon plug stopcock. The cell top was fabricated of plexiglass at SIO, and is attached to the bottom with an o - ring seal. The cell top has seven holes or ports with the following functions:
- Combination glass pH electrode;
- Glass sheathed temperature sensor (thermistor);
- Water (sample) inlet (glasstube);
- Glass capillary tip for acid delivery;
- Glass vent tube for an approximately 5 ml capacity bladder made of a finger of a latex rubber surgical glove;
- Valve made of glass rod bent to allow sealing of water inlet;
- Glass cell vent tube with cap.
All ports have o - ring seals.
2. Glass pH electrodes
The electrodes used were Orion - Ross combination glass pH electrodes (general purpose standard bulb). A pH meter was not used; instead, the electrode voltage output was connected to an isolation amplifier (voltage follower) that served as an impedance buffer between the electrode and a digital voltmeter.
C. Sample aliquoting system and calibration
1. Description of system
Two 100 ml size glass syringes (of Japanese manufacture by "Star") were mounted on an optical bench and the syringe plungers were driven by a stepper motorized precision lead screw. Delivery of a constant volume of sample was accomplished by commanding the stepper motor to turn a preset number of counts.
2. Syringe volume delivery determinations
Syringe volume calibrations were done by weighing deliveries of samples of known density (either pure water or sea water). Pre-cruise cruise and post-cruise laboratory calibrations of the syringe delivery volumes agreed to better than one part in 7000. Three sets of calibrations of both syringes were made at sea by delivering sea water samples of known salinity into pre - weighed bottles. The bottles were sealed with rubber septums and later weighed in the shore laboratory. Seven deliveries were done for each calibration set; the sample standard deviation for each set was better than one part in 4000. Five of the six sets agreed with the laboratory calibrations to within one part in 3000; one set was off by one part in 750. Titration data on the quality control standards showed no such effect; the anomalous calibration set was therefore ignored. The ALK data reported here were calculated using the pre - field volume calibrations for the syringes (91.193 ml for the left side syringe, serial number 7759; and 91.152 ml for the right side syringe, serial number 7736).
D. Acid titrant delivery system and calibration
1. Description of system
The acid titrant was 0.1N hydrochloric acid in an aqueous sodium chloride matrix of approximately 0.7 ionic strength. Doses of acid were added to the titration cell under computer control from a Metrohm Dosimat 665 automatic burette. The plastic acid line from the Dosimat (5 ml size burette) was connected to a capillary glass tip for entrance into the titration cell.
2. Acid dose scheme
A total of 26 doses were made during a titration, with a total of 3.4 ml of added acid titrant. Prior to and after the second (bicarbonate) equivalence point, the doses were of 200 microliters. Around the equivalence point, from 2.0 ml to 2.6 ml, the doses were of 50 microliters in order to weigh the titration curve fit to that region for total alkalinity determination.
3. Acid preparation
The acid titrant was prepared in a batch (designated batch number 9) of 20 liters and bottled in one liter reagent bottles with greased stoppers. During the cruise six different bottles of acid were used. Bottles were changed when half empty.
4. Acid density determination
Acid densities were measured with a pycnometer at two different temperatures, 21 and 25oC. A linear equation from the data was used to calculate the acid density for a titration according to the temperature measured with a thermistor (surface probe) attached to the glass Dosimat burette.
5. Acid concentration determination
The acid titrant concentration was determined by titration of sodium carbonate solutions. These were prepared by solution in purified water of primary standard sodium carbonate heated to constant weight at 270oC. Titrations of standard carbonate were done on two bottles of the acid batch, one prior to the cruise and one after. These titrations were performed on the shore based gravimetric titration system (Guenther et al, 1994). Results are summarized in the following table:
| Date | STD Bottle-Trial | Acid Bottle No. | [HCl](eq/kg) |
|---|---|---|---|
| 23 May 91 | 59-2 | 9D | 0.09731 |
| 23 May 91 | 60-2 | 9D | 0.09725 |
| 1 Sep 92 | 69-4 | 9B | 0.09729 |
| 1 Sep 92 | 70-3 | 9B | 0.09724 |
The average of the four determinations is 0.09727 +/- 0.00033 eq/kg. The value used to calculate the reported data is 0.09724 eq/kg, representing about 0.75 microeq/kg difference in calculated alkalinities.
E. Temperature measurement and calibration
1. Description of system
Several temperatures were measured in the titration procedure, using YSI thermistor probes. The aliquot temperature was measured with a metal probe immersed in the sample bottle. This temperature was recorded by the operator from the computer output when the syringe was filled and later entered into the titration data file prior to the titration. The acid temperature was measured with a surface probe attached to the Dosimat burette and recorded for every dose of titrant. The average temperature during the titration was used for calculation of the acid density. The cell temperature was measured with a glass sheathed immersion probe and recorded for every dose. The temperature at the midpoint of the titration was used in the calculation of alkalinity. The ambient air temperature was measured with an air probe during the titration and recorded, but not used in the calculations.
2. Thermistor calibrations
Thermistors were calibrated at the Oceanographic Data Facility of SIO by comparison to standard thermometers, with the assistance of Mr. Robert Williams. One set of calibrations were done prior to the cruise and another after the cruise, in summer 1992. Calibration curves for the probes were very similar to one another and the two calibration sets agree very closely.
F. Data acquisition system
The titrator had two identical computerized data acquisition systems, one for each side of the titrator. The thermistor resistances and the electrode voltage (after passing through the isolation amplifier) were measured with a 5 1/2 digit Hewlett Packard digital multimeter. The electrode voltages were measured on the +/- 300 mv scale and recorded to 0.01 mv. A switching box and scanner allowed the multiple inputs to be recorded on hard disc under program control of a Zenith 286 lap top computer equipped with a data acquisition expansion chassis. The operating program also controlled the addition of acid titrant doses by the Dosimat burette.
At the end of a titration, recorded data was copied to a 3 1/2" HD diskette for archiving and later calculation of the alkalinity. One saved file contains one set of data for each titration point, i.e. the final stable electrode EMF's and associated temperatures. Another saved file contains 1/2 second averages of the electrode EMF's throughout the titration, allowing the electrode behavior and stability for every titration to be recreated.
G. Calculation of total alkalinity
The total or titration alkalinity was calculated from the titration data set using a non - linear least squares fit of the entire titration curve. A description of this procedure is given in the Department of Energy Handbook of Methods (DOE, 1994). In this procedure, the residuals of the fit are minimized by adjustment of four parameters: the bicarbonate equilibrium constant, K1; the ALK; the DIC; and f, related to the E0 of the system. Codes entered by the operator identified the sample as either sea water or bicarbonate in sodium chloride solution and the appropriate constants and densities were then selected by the program.
The sets of chemical equilibrium constants used in the fit routine to calculate the alkalinity were as follows:
For 0.7M NaCl:   K1 (bicarbonate) :  Dyrssen and Hansson   (1972)
                 K2 (carbonate)   :  Dyrssen and Hansson   (1972)
                 Kw (water)       :  Dyrssen and Hansson   (1972)
For sea water:   K1 (bicarbonate) :  Dickson and Millero   (1985)
                 K2 (bicarbonate) :  Dickson and Millero   (1985)
                 Kw (water)       :  Dickson and Riley     (1979)
                 Kb (borate)      :  Johansson and Wedborg (1981)
                 Ks (sulfate)     :  Khoo et. al.          (1977)
                 Kf (fluoride)    :  Dickson and Riley     (1979)
relation to SAL: Total borate     :  Uppstrom              (1974)
                 Total sulfate    :  Morris and Riley      (1966)
                 Total fluoride   :  Riley                 (1965)
Phosphate and silica were assumed to be equal to zero. According to Dickson (DOE, 1994), this assumption has a negligible effect on the calculated alkaliniy.
For every titration a graph was produced that displayed the residuals of the fit versus the actual data. Titration data files were copied into a master computer directory to allow refits of the titration data after final calibrations and adjustments to the data. All data, including the 1/2 second averages, have been archived at SIO.
H. Titrator operating procedure
Two bottles of water to be analyzed are placed in holders above the syringe driver assembly and allowed to adjust to ambient temperature. Residual prior samples are emptied from the syringes using the three way valves at the tips. The syringes and connective tubing are filled and emptied with small volumes of new samples, then the syringes are allowed to fill through a mostly glass (Tygon connection pieces) tubing system from the bottoms of the sample bottles. The temperatures of the samples as measured by the thermistor probes in the sample bottles are read from the computer screens and recorded for later entry.
The titration cells and water delivery tubing are prepared by a rinsing and flushing procedure. First the caps are removed from the cell vent tubes. The previous samples of acidified water are drained from the cells, then the cells are rinsed with purified water. The glass tubing leading from the syringes to the cells are flushed simultaneously with preset injections of 15 ml, using the syringe driver mechanism. The syringes are now set at a constant starting point. The valves at the sample inlets to the cells are closed. The cells are rinsed two more times and allowed to soak for a few minutes while stirring. The acid titrant tips in the cells are flushed with injections of 50 microliters; and the cells are drained then rinsed again to just below the acid tips. The cell drain stopcocks are closed and the syringe delivery tubing again opened to the cells. The cells are now ready to be filled with samples. The syringe driver motor is switched on to move the syringes a constant distance for simultaneous injection of aliquots into both cells. The sample entry tubes in the cells are closed with the valves. The submerged bladders are inflated using bulbs to reduce the cell air spaces to a minimum volume, one to two cc including the visible bubble and the volume of the cell vent tube. The cells are then closed by placing air tight plastic caps on the cell vent tubes. The bulbs are removed from the tubes leading to the bladders so that the insides of the bladders remain at atmospheric pressure during the titrations. The stirrers are turned on and the cells allowed to equilibrate to the operating temperature maintained by flowing water from a refrigerated constant temperature bath through the water jackets on the cells.
The computer data acquisition program prompts the operator to enter sample identification, sample type (sea water or bicarbonate in sodium chloride solution), salinity, and sample aliquot temperature. The "salinities" assigned to the bicarbonate reference materials were 38.00 for the SIO STD's and 38.43 for the Certified DIC Reference Material, batch number 6 (A. Dickson, private communication). When temperature stability has been reached, in about ten minutes, the titration programs are started and the first doses added. At each point on the titration curve, the program evaluates the electrode output stability according to a preset criterion. When stability is reached, the electrode EMF and the cell, acid burette and ambient air temperatures are recorded and the next dose of acid is injected.
The complete analysis cycle is about 30 minutes long; thus, about four titrations can be completed per hour.
I. Daily analysis schedule
With only a single operator on board ship, the titrator was operated each day during the cruise for approximately 12 hours, interrupted by water sampling activities on station. An average of 27 titrations per analysis day were run. The usual analysis sequence was as follows. The first set of analyses were of two sea water samples. The second set consisted of reference materials for quality control. One reference material was a bicarbonate solution prepared by the CDRG at SIO. These were prepared in 20 liter batches by bubbling ambient air through solutions of sodium carbonate in 0.7 ionic strength sodium chloride until the pH reached stability. On this cruise 800 ml vitreous quartz bottles filled with solutions from two batches (named STD No.'s 19 and 20) were analyzed. Three to five titrations were performed on each bottle. The second reference material was a bottle of Dr. Andrew Dickson's Certified DIC Reference Material Batch No. 6. This batch was prepared from bicarbonate mixed in a sodium chloride solution matrix: the same kind of "artificial sea water" as the STD's. Normally two analyses were done on each CRM bottle after a DIC analysis had been made on the SOMMA coulometric system. After the pair of reference materials were titrated, sea water samples were run. Samples were normally analyzed in order of depth, from shallow to deep. About halfway through the analysis day, another set of reference materials were run, this time reversed in titrator side sequence. That is, for every set of reference materials, the STD and CRM are alternated between the left and right sides of the titrator. At the end of the day, a third set of reference materials were run. Thus on one day there would be three analyses of STD's and two analyses of CRM's, and on the next day two of STD's and three of CRM's.
V. Summary of Results
A. Data quality assessments
1. Replicate sea water samples
During the cruise eleven pairs of replicate samples were collected, i.e. two sample bottles were filled with water from the same Niskin bottle. The bottle pairs were titrated together, one bottle on the right side of the titrator and the other on the left. The sample standard deviation calculated from the pair data, assuming the left and right sides were not systematically different, was 1.11 microequivalents per kilogram.
2. SIO bicarbonate reference materials
A total of 47 titrations on bottles of STD batch 19 were done, four of which were omitted from consideration due to identified operator error or titrator malfunction. For batch 20, there were 33 total titrations, with one omission. The results are summarized in the following table:
 STD Batch   No. of analyses    Avg. ALK            Sample std. dev.
                                (µeq/kg)                (µeq/kg)
    19              43           2320.00                  1.51
    20              32           2320.99                  1.54
Analyses of samples of these batches of STD were made before and after the cruise in the shore laboratory on the gravimetric titration system, with the following results:
 STD Batch   No. of analyses    Avg. ALK            Sample std. dev.
                                (µeq/kg)                (µeq/kg)
    19              19           2320.69                  2.83
    20               7           2319.64                  2.03
Figure 3 amd Figure 4are versions of control charts for the shipboard STD data. The individual results are plotted for each STD batch, with the overall mean and the two times and three times standard deviation levels shown. One of the omitted data points is plotted on the STD 19 chart - the only plotted point greater than the three times level. All of the other omitted data are off the scale of the charts.
3. CRM bicarbonate reference materials, batch 6
A total of 82 titrations of CRM batch 6 water were done during the cruise. In most cases aliquots had previously been removed from the CRM bottles for coulometric DIC analysis. Two titrations were omitted from consideration due to known operator error or instrument malfunction. At the shore laboratory, 24 analyses were made on this batch of CRM on the gravimetric titration system. These results are shown in the following table:
                      No. of
    Titrator         analyses         Avg. ALK        Sample std. dev.
                                      (µeq/kg)            (µeq/kg)
  volumetric (sea)      80             2380.46              2.19
  gravimetric(shore)    24             2380.39              2.63
Figure 5 is a control chart for the shipboard analyses of CRM batch 6 samples. One of the omitted values appears, again the only plotted point greater than the three times standard deviation level. This chart displays a hint of an upward drift towards the end of the cruise.
4. Discussion of data quality
Multiple titrations of replicate sea water samples, CRM's and STD's during the cruise demonstrate that the imprecision of the shipboard titration system is at the level of approximately 2 microequivalents per kilogram (one standard deviation). Comparison of CRM and STD results made at sea on the volumetric titrator to those made in the shore laboratory on the gravimetric titrator demonstrate that the two systems agree within the analytical imprecision. This is an important observation since calibration of the concentration of acid titrant used on the shipboard system was done on the shore based gravimetric system. On the question of accuracy of the results, it can be stated that influences due to temperature, density and volume measurements are likely to be small, close to the analytical imprecision, based on results reported here. The question of the accuracy of the acid calibration and indeed of the titration method overall is less clear due to the lack of a Certified Reference Material for ALK. Interlaboratory comparisons indicate that the accuracy level may be +/- 10 microequiv./kilogram or more.
B. Data tabulations of shipboard alkalinity results
1. Sea water sample data
The table lists results from all titrations in the data set. The seventh column, headed TRIAL, lists the sequential number of the titration on the same bottle of water. In most cases, only one was made. The "a" and "b" refer to duplicate samples collected from the same Niskin bottle. The eighth column, headed FLAG, identifies with an "EX" those calculated titrations that were affected by identifiable operator error or titrator system malfunctions. Common problems included:
- An air bubble in the acid titrant delivery line (easily identified on the residual plot);
- Loss of water during filling of the titration cell (sometimes identified after the titration has been run);
- Problems with the pH electrodes or isolation amplifiers.
The ninth column, headed TRIAL ALK, is the individual result for one titration trial. The tenth column, headed TRIAL DELTA, is the difference between good trials on aliquots from a single sample of water. The eleventh column, headed BOTTLE ALK, is the average of all the good trials made on water from one bottle. The twelfth column, headed BOTTLE DELTA, is the difference between analyses of water from duplicate sample bottles. The thirteenth column, headed "NISKIN" AVG is the average alkalinity obtained for a single Niskin bottle. In most cases, with a single titration per Niskin bottle, columns nine, eleven and thirteen are identical, and nothing appears in columns ten and twelve.
2. SIO bicarbonate reference material data
Two tables report the shipboard alkalinity results for the SIO bicarbonate reference materials, designated STD 19 and STD 20. The tables are arranged in order of analysis date during the cruise. The individual bottles of each batch are identified by a letter after the 19 or 20. The third column, headed TRIAL, is the sequential number of the titration on the same bottle of water. The fourth column, headed FLAG, identifies with an "EX" those calculated titrations that are affected by identifiable operator error or titrator system malfunctions (same examples as listed above). The fifth, sixth and seventh columns list the individual trial alkalinities and the overall average and sample standard deviation of all the titrations during the cruise.
3. CRM bicarbonate reference material data
The last table reports the shipboard alkalinity results for Certified DIC Reference Materials, batch number 6. The columns have the same meaning as described above for the SIO reference materials. The letters following the CRM sample bottle number are used for internal accounting purposes.
List of References
- DOE (1994) Handbook of methods for the analysis of the various parameters of the carbon dioxide system in sea water; version 2, A. G. Dickson & C. Goyet, eds. ORNL/CDIAC-74.
- Guenther, P. R., Keeling, C. D. and Emanuele, G. Technical data report: Oceanic CO2 measurements for the WOCE hydrographic survey in the Pacific Ocean, 1990 - 1991: Shore based analyses (in press as report of the Carbon Dioxide Information and Analysis Center), 1994.