P02
- Nitrate
- Phosphate
- Silicate
- Oxygen
- TCO2 - Adjustment of -4 µmol/kg recommended.
- Crossovers:
Crossing # Latitude Longitude WOCE Line Station(s) used Crosses with Station(s) used Delta TCO2 Stdev TCO2 10 30° N 148° E P2 74,77 P10 37 2.8 1.0 23 30° N 165° E P2 54,55 P13 48 5.5 2.1 28 30° N 178° E P2 63 P14 58 -0.5 2.7 36 30° N 165° W P2 52,54 P15N 65 5.7 4.4 49 30° N 152° W P2 30,31,32 P16 70 7.6 3.0 61 30° N 135° W P2 26 P17 78 3.1 4.6 MEAN 4.0 2.8 - Precision of Duplicate Measurements - No Information.
- CRM Results - No Information.
- Multiparameter Analysis (details) - Mean Difference (estimated - measured) = -4.3 ± 5.4
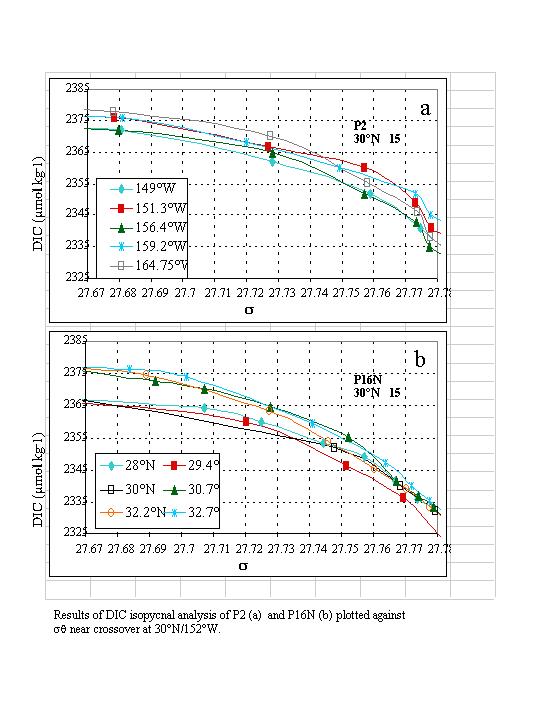
- Isopycnal Analysis - Results of our isopycnal analysis of P2 and P16N TCO2 near 30° N, 152° W indicates consistently higher TCO2 values (8-10 µmol/kg) in deep water on the P2 line as with P16N (Figure). The P14 data along 179W also show slightly higher deep water values (mean = 4 µmol/kg) than the P16N results. In the previous crossover and MLR analyses P14 showed no obvious offsets, whereas the P2 were generally found to be high and the P16N data were consistently low. The results of the isopycnal analysis can be reconciled with the findings of the other methods if the P16N data are increased by ~4 µmol/kg and the P2 data are decreased by 4-6 µmol/kg.
- Alkalinity- Adjustment of +14 µmol/kg recommended.
- Crossovers:
Crossing # Old # Latitude Longitude Cruise 1 Cruise 1 Sta Cruise 2 Cruise 2 Sta TALK Delta Stdev 10 30° N 148° E P10 74,77 P2 37 16.9 ± 9.7 (graph) 23 30° N 165° E P13 54,55 P2 48 12.9 ± 1.2 (graph) 28 30° N 178° E P14N 63 P2 58 8.4 ± 2.4 (graph) 36 30° N 165° W P15N 52,54 P2 65 14.8 ± 6.7 (graph) 49 30° N 152° W P16N 30,31,32 P2 70 3.2 ± 0.2 (graph) AVERAGE 11.2 ± 5.5 - Precision of Duplicate Measurements - No Information.
- CRM Results - No Information.
- Multiparameter Analysis (details) - Mean Difference (estimated - measured) = 17.1 ± 4.2
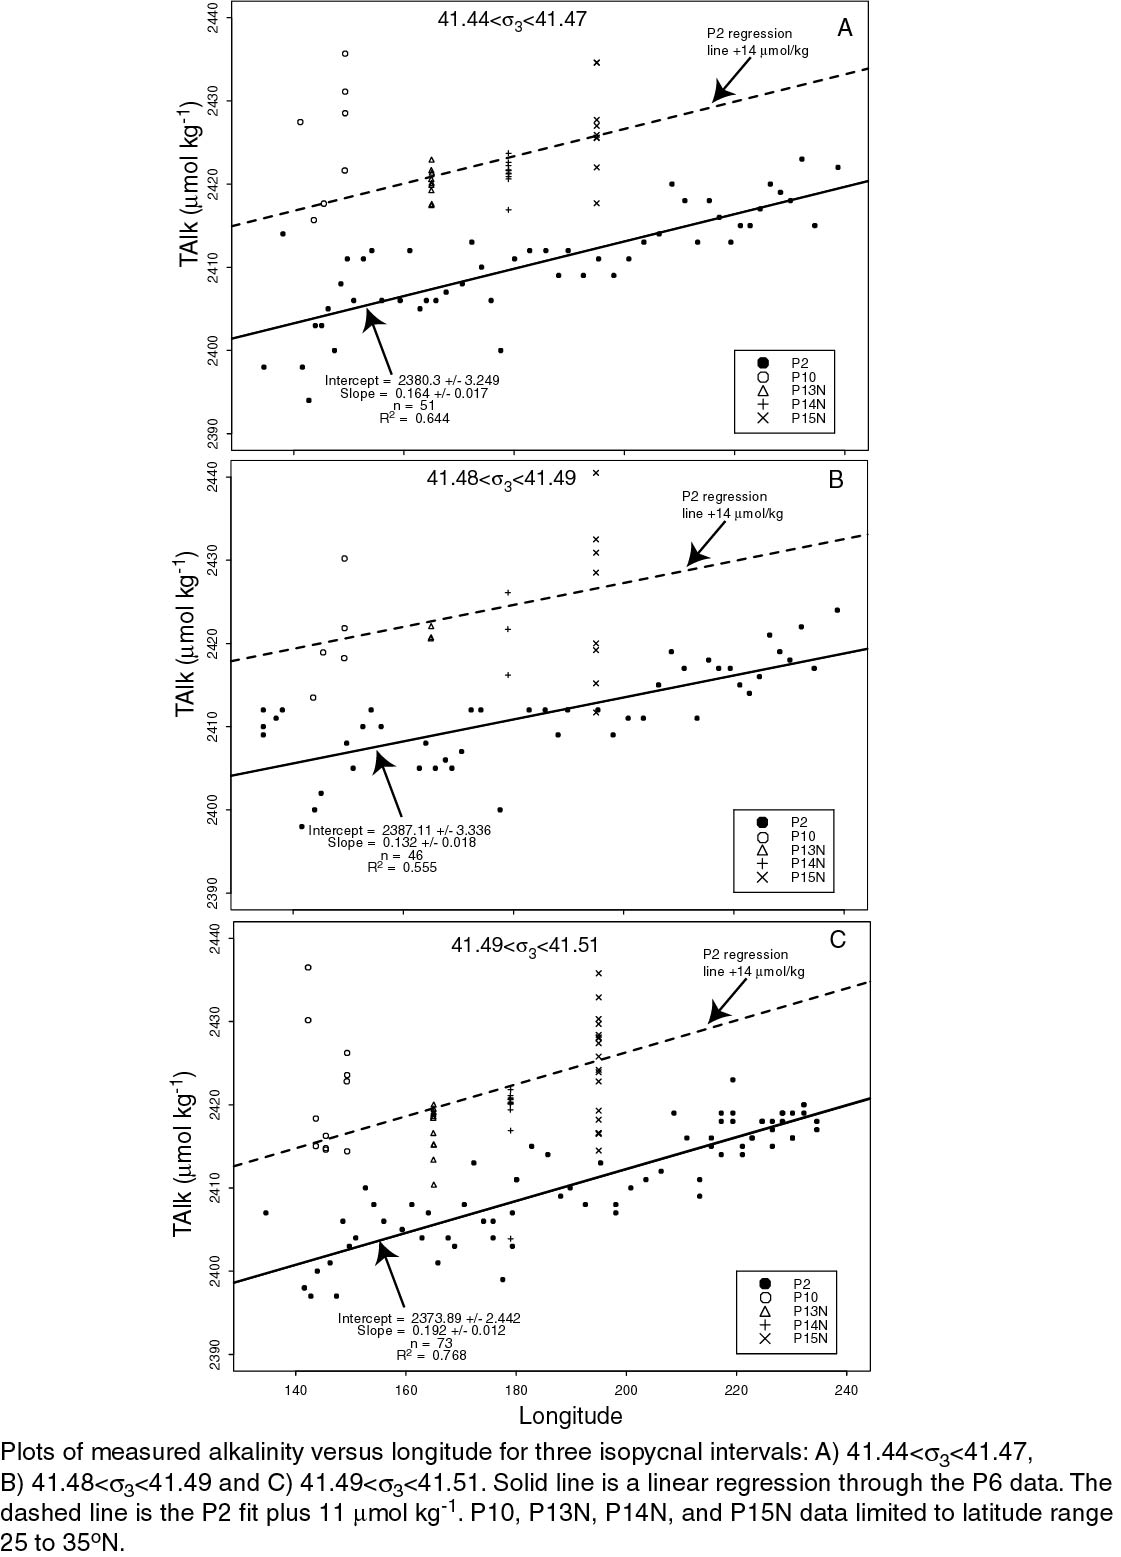
- Isopycnal Analysis - An isopycnal analysis was used to evaluate the P2 data relative to the meridional cruises that it crosses. The P2 data were plotted as a function of longitude for three isopycnal intervals representing data between 3000 and 4000 m (Figure). Values from P10, P13N, P14N and P15N, with latitudes between 25 and 35° N, were consistently higher than the P2 data indicating that a significant positive correction is necessary for this cruise.
- fCO2 (Not Measured)
- pH - No adjustment recommended.
- Crossovers - No Information.
- CRM Results - No Information.
Last modified: 2021-03-17T18:30:27Z