OCADSAccess DataFig. 2

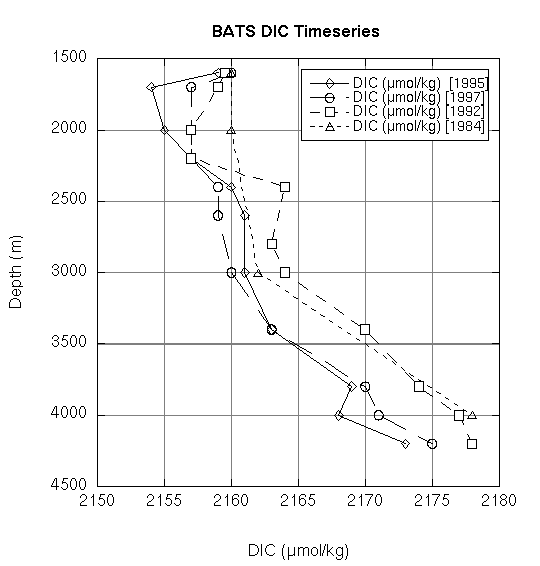
Fig. 4. Plot of deep DIC at the Bermuda time series station (BATS).
The circles are data for 1997, the diamonds for 1995, and the open squares for 1992. The open triangles are samples from nearby Hydrostation S for 1984, analyzed by manometry by C. D. Keeling of the Scripps Institute of Oceanography. The small changes are a combination of inaccuracy in measurements and water-mass movement (data courtesy of Nick Bates, Bermuda Biological Station for Research).
Last modified: 2021-03-17T18:30:24Z
