The Seasoar, manufactured by Chelsea Instruments, Ltd., is a towed vehicle equipped with impeller-forced wings that can be adjusted to undulate in the upper ocean. The wings are controlled by signals from the ship, and moved by an hydraulic unit. The Seasoar undulates between 0-450 dbars while being towed at about eight knots, cycling to the surface approximately every 12 minutes. The Seasoar group participated in four cruises during the experiment ( Table 1). On the initial cruise in May 1991, 18 bobbers were deployed, three mesoscale surveys ("star patterns") and a frontal survey were completed (Luyten, 1991). In Feb 1992, a second frontal survey was completed (Rudnick, 1992). The following November, six star patterns near bobbers and two long transects were executed (Joyce, 1992). The final cruise, May 1993, surveyed near four bobbers and towed along three long transects (Luyten, 1993); (Fig 1, Table 2). In conjunction with four star patterns (two on the first and two on the last cruise), a series of closely spaced CTD stations, using a profiling CTD, were made overlaying the star pattern in an L-shaped pattern for the tracer studies. We used the CTD data from these stations to augment the Seasoar dataset. All cruises were on the R/V Oceanus.
2. Methods
a- Temperature, Conductivity and Pressure
The Seasoar CTD is a Sea-Bird model 911 with redundant sensors for
conductivity and temperature and a single oxygen sensor. Data
were telemetered to the ship at 24 Hz. The CTD sensors are openly
mounted on the top cover of the vehicle, the temperature sensors are
located behind and slightly above the conductivity cells ( Fig, 2 ). Peak flow rates past the sensors
typically reached 5 m/s, with occasional extremes of 7 m/s. Flow rate
exceeded the capabilities of the standard pump on Sea-Bird CTD's and
therefore no pumping of sea water through the sensors was done. Seasoar
sensors were exchanged with those on a pumped profiling CTD, also a
Seabird 911, for calibration purposes where they could be compared with
rosette samples directly. The 24 Hz data were logged and displayed on
a personal computer (PC) or a Sun Computer.
b- Location of Bobbers
In May 1991, 18 bobbers were launched during Oceanus Cruise 240, Leg
2. The bobbers are sound fixing and ranging (SOFAR) floats which
control their buoyancy to cycle every other day between prescribed
isotherms. (J. Price, personal communication) Bobbers transmit a swept 250
hertz signal for 80 seconds, precisely 12 hours apart on a preset
schedule. The range to the float can be derived from the travel time
and the speed of sound in the water. While at sea, on board tracking
was done using shipboard listening stations and SOFAR receivers.
Either special hydrophone arrays or a Sonobouy float was used at these
stations to listen for the bobbers. In addition, drifting SOFAR
receivers (DSRs) and ALFOS floats, which were deployed from the ship
earlier, relayed the times of arrival (TOAs) of bobber signals to WHOI
via ARGOS satellite. The TOAs and receiver position were then
transmitted to the ship via INMARSAT FAX where the range from the
drifting receivers to the bobber was calculated. Range information
from two or three receivers was combined to locate the bobbers by
triangulation. On the final cruise, the moored Autonomous listening
stations (ALS), which had been recording TOAs from the bobbers since
May 1991, were recovered. The ALS data were decoded and actual
positions were determined for the bobbers for the times of the Seasoar
surveys (Price et. al., 1995, in progress) (
Fig. 3a - Subduction 3, Fig. 3b -
Subduction 4).
The temperature sensors were corrected for drift based on the lab
calibrations alone, by assuming a linear change in time between two
calibrations. Corrections to the lab calibrations were +/- 0 to 2 mK
(offset) and 1 +/- 0 to 0.15 mK/K (slope).
Using the corrected temperatures, water sample salinities from
approximately seven deep stations per cruise were converted to
conductivity for comparison with the conductivity sensors. The
calibration for conductivity in shallow water where the vertical
gradients are large and spatially variable is particularly difficult.
The profiling CTD maintained one sensor pair (primary) throughout a
cruise, the secondary sensors were swapped with the Seasoar's for
calibrations. Thus, the primary sensor pair had the greatest number of
water samples to use for calibration. For cruises one and three, we
determined the Seasoar sensor calibration by performing a water sample
calibration for the primary CTD sensors, and then fit the secondary
sensors to the primaries using data from the complete cast. The bottle
data for the secondary sensors then served as a consistency check for
the obtained calibration values. For Subduction 4, however, this
approach generated a correction to the pre-cruise lab calibration that
largely exceeded the post-cruise lab calibration. This can not occur
if the sensors drift essentially linearly in time. We therefore relied
only on the direct bottle comparison to calibrate the Seasoar
conductivity sensors. Additionally, the vertical conductivity gradient
during this cruise was at times so strong that the vertical separation
of 1.5 meters between bottles and sensors introduced an error large
enough to affect the calibration. To correct for the spatial
difference, a polynomial fit of the conductivity gradient was
determined for each station, and an offset was applied based on the
polynomial and the distance between bottles and sensors. The
conductivity gradients from the other cruises were not large enough to
require this correction. Conductivity corrections ranged from -1.7 to
+0.7 mS (offset) and 1 +/- 0 to 0.6 mS/S (slope). The remaining
differences between calibrated CTD conductivity and bottle
conductivities were of the order of 0.2 mS/m (deep samples) to 0.5 mS/m
(shallow samples), corresponding to salinity differences of 0.002 to
0.005 psu.
The calibrated 24 Hz data were then screened for anomalous points using
a 9-point median filter. To determine the proper relationship between
temperature and conductivity sensors influenced by their physical
separation and sensor response times, salinity was calculated for
various lags of temperature and pressure relative to conductivity. A
lag of 4 scans (1/6 second) was found to minimize salinity spiking
across sharp gradients. This lag was consistent over the course of the
experiment. The data were edited further by excluding data shallower
than 1 dbar. This excludes salinity spikes due to air in the
conductivity cell when the Seasoar breaks the surface. Summary Figures
for quality control were produced (Fig. 4 ).
The data were then binned into 1 and 3 sec datasets (available in ASCII
and matlab format on CDROM) of time, pressure, potential temperature,
salinity, and potential density. Salinity and potential density were
calculated after binning.
The 3 second averaged data were interpolated onto a uniform grid in
depth/distance along the Seasoar track using a second order exponential
filter with vertical and horizontal scales of 5 dbar and 4km,
respectively. Grid points for which the sum of weights were less than
or equal to 0.1 were flagged (Fig. 5 ). Data
were then mapped onto density surfaces at intervals of 0.05 sigma-theta
(Table 3, Fig. 6).
Where appropriate, CTD data from the L-shaped tracer surveys were
combined with the Seasoar data and input into the objective mapping
programs. We chose to focus on sigma-theta levels of 26.5, 26.7 and
26.9. The levels correlate with the isotherm boundaries and
corresponding average densities of the bobbers when they were initially
deployed. (Fig. 7,). The thickness of each
density surface is based on the density gradient centered on the
density surface of interest with a fixed density difference of 0.05
Sigma-theta. The mapping technique used a spatial correlation scale of
10 km, and a signal to noise ratio of 50 percent was assumed. Areas
with errors exceeding 95 percent were not contoured. Data was
objectively mapped for all Seasoar surveys on the above-mentioned
density surfaces for potential temperature, salinity, pressure and
thickness ( Fig. 8).
Despite the variety of shipboard location tools for determination of
bobber position, the actual location of bobbers during the experiment
was problematic. In some instances, insufficient fixes were available
to locate bobbers or two Seasoar surveys were carried out because of
possible ambiguities in bobber location. Why post-experiment bobber
tracks (using the moored ALS data) seem to be 'offset' from at-sea
locations has not been resolved. Thus, the Seasoar maps around bobbers
should be considered only to reflect the general characteristics of the
water masses at that particular time.
The ADCP data were processed with the Common Oceanographic Data Access
System (CODAS) software developed by Eric Firing from the University of
Hawaii (Bahr et al., 1990). After the data were loaded into a
database, the individual profiles were edited for anomalous points
based on editing criteria such as large second vertical derivatives of
eastward (u) and northward (v) velocity components, large vertical (w)
and error velocities, and subsurface maxima of backscatter amplitude.
Aside from the usual amplitude warnings triggered by either bottom
interference or biological scattering layers, we found occasional
interference from the hydrowire when the CTD package had drifted into
one of the ADCP beams. Next the GPS fixes were screened for outliers
based on number of satellites used and Horizontal Dilution of Precision
(HDOP) values, and then merged with the ADCP data to provide absolute
velocities. This step involved the intermediate calculation of the
absolute velocity of a reference layer (e.g., Kosro,1985, see Table 4for layer range). The velocity of the
reference layer is the difference between the velocity of the ship over
the ground, determined by the fixes, and the velocity of the ship
relative to the reference layer, calculated from the ADCP profiles.
This initial estimate of the reference layer velocity, which is
constant between fixes, was then smoothed by convolution with a
Blackman window function (Blackman and Tukey, 1959). The choice of
filter width generally depends on the quality of the fixes. For
Subduction 1, which occurred shortly after the Gulf war Desert Storm,
selective availability (SA) was not in effect, and the fix quality was
accordingly good. SA was in effect, however, for Subduction 3 and 4,
and the filter needed to be correspondingly larger(Table 4 ).
Bottom track calibration was performed using mostly the Woods Hole
continental shelf data, since the island bottom tracking was often too
short. Underway calibrations were done on cruises with many CTD
stations. In this type of calibration, accelerations measured by the
ADCP (e.g., when departing from station) are compared with
accelerations measured by the satellite navigation. This method has a
large uncertainty associated with each individual calibration point and
a large number of points need to be taken. Calibration values were computed
for each cruise from a combination of bottom track and water track information
(Table 4 ).
In order to produce maps of velocity on density surfaces, temperature
and salinity profiles were generated from 15-minute averages of the
Seasoar data. Using this database, the ADCP data were vertically
regridded on density, and 30-minute averaged vectors over the two
shallower density intervals were calculated (
Fig. 9). In addition, 30-minute averages of ADCP velocity along the
original depth bins were produced in ASCII format (Available on CDROM).
The 'star' patterns were carried out in order to map the variability
around the bobber floats. During the initial cruise, the star patterns
each consumed about 45 hours of shiptime. The long legs of the patterns
were approximately 110 km in length. An analysis of temperature,
pressure, and thickness variations on the individual legs indicated
that the de-correlation scale was 8-10 km. Error maps made from the
objective mapping of the data showed that the star pattern was too
large: large areas within the pattern were poorly mapped. In
subsequent cruises, the scale of the pattern was reduced so that the
long legs of the pattern were approximately 80 km. Not only did this
better 'map' the variability, it took less shiptime (27 hrs/survey)!
Seasoar data were summarized for each star pattern surveyed during the
subduction experiment. The gridded data were mapped onto density
surfaces of 0.05 sigma-theta. Plots of pressure, potential
temperature, salinity and thickness vs potential density for each
survey are presented in figures A-1 - A-13. Location and time of the survey
is described in Figure 1 and
Table 2.
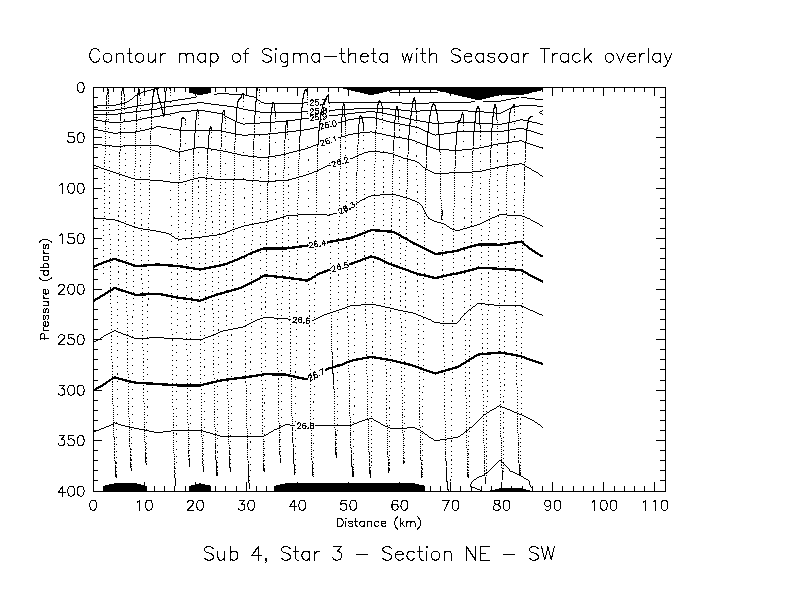
Contour plots of gridded Seasoar data along selected sections of
the radiator pattern are shown in the following figures B-2 - B-15.
Each figure consists of a Sigma-Theta, theta and salinity contour plot
for the specified section. Location of the section on the star pattern
is highlighted on the star pattern shown in figure B-1. Position and
time of the individual star pattern is described in Figure 1 and Table 2. Gray
areas denote unavailable data. The darker lines represent the average
theta and sigma-theta where the bobbers were deployed during Subduction
1. (see Fig. 7).
Contour plots of gridded Seasoar data along several long transects
during the Subduction 3 and 4 cruises proceed in figures C-1 - C-21.
Position and time of the transects can be located on
Figure 1 and Table 2.
Gray shading denote areas of unavailable data. The darker lines
represent the average theta and sigma-theta where the bobbers were
deployed during Subduction 1. (see Fig. 7).
Color versions of these sections are available
on the accompanying CDROM.
Figures D-1 - D-110 present objectively mapped plots of ocean properties on
potential density surfaces of 26.5, 26.7, 26.9. Theta, pressure and
thickness are individually plotted on the selected surfaces. The
triangles on the plots denotes 15 minute averages along the cruise
track. Color versions of these maps are
available on the accompanying CDROM.
Figures E-1 - E-12 show ADCP velocity maps for each star pattern on potential
density surfaces of 26.5 and 26.7. ADCP vectors were averaged in
density space over 0.05 sigma theta.
c- Data Processing
The CTD temperature and conductivity sensors were calibrated for each
cruise using a combination of lab calibrations (done by Sea-Bird at the
North-West Calibration Center) and comparisons with water samples
collected on a profiling CTD. All sensors were calibrated before the
initial cruise and following all subsequent cruises.
d- Underway Currents - ADCP
Shipboard Acoustic Dopler Current Profiler (ADCP) data were collected
during all four Subduction cruises using a standard 150KHz RD Instruments
transducer. The setup used 8 meter vertical bins with 8 or 16 meter
pulse lengths averaged over 5 minutes. Bottom tracking data were
collected over the continental shelf leaving Woods Hole, and for very
short periods over the slopes of the Azores, Madeira and Gran Canaria.
One-second navigation data were provided by a Magnavox MX4200 Global
Positioning System (GPS) receiver. Discussion
The initial deployment cruise for the bobbers, in May 1991, came just
as the water column began to stratify. The remnant mixed layer was deep
and reflected the characteristics of late winter conditions. The
density modes for the first two star patterns indicated that the
initial winter mixed layer depth was between 100 and 150 meters (See
Appendix B: Figs. Sub 1, Star 1 - Section SE-NW and Sub 1, Star 2,
Section SE - NW). The subduction bobber cruises were distributed in
time in such a way as to cover a two years lifespan. However, due to
the concentration in the northern region near the Azores Front on the
second cruise (February 1992), no Seasoar data were collected near any
of the bobbers. Thus, the temporal sampling between the bobber cruises
was uneven, with intervals of 18 and 6 months. Acknowledgments:
The Subduction ARI experiment was sponsored by the Office of Naval
Research, grants N00014-91-J-1585 - Mesoscale Variability of
Subduction Waters (T. Joyce) and N00014-91-J-1508 - Seasoar Operations
in Subduction and N00014-91-J-1425 - Subduction in The Subtropical Gyre
(J. Luyten). We wish to thank the captain and crew of the R/V
Oceanus. Bobber locations were received from James Price and Christine
Wooding. References:
Bahr, F., E. Firing, and S.N. Jiang, 1990.  Acoustic Doppler
  current profiling in the western Pacific during the US_PRC
  TOGA cruises 5 and 6.  Data report No. 007 from the Joint
  Institute for Marine and Atmospheric Research, University
  of Hawaii.  161 pp.

Blackman, R.B. and J.W. Tukey, 1959.  The measurement of power
  spectra.  Dover, New York, 190 pp.

Joyce, T.M., 1992. Cruise Report OC254/4: Subduction 3.
  Woods Hole Oceanographic Institution, Woods Hole MA.
  Unpublished manuscript. 21 pp.

Kosro, P.M. 1985.  Shipboard acoustic current profiling during
  the Coastal Ocean Dynamics Experiment.  SIO reference 86-8,
  119 pp.

Luyten, J.R., 1991.  The Subduction Experiment: Cruise Report
  OC240/2.  Woods Hole Oceanographic Institution, Woods Hole MA.
  Unpublished manuscript.  20 pp.

Luyten J.R., 1993.  The Subduction Experiment: Cruise Report
  OC258/3.  Woods Hole Oceanographic Institution, Woods Hole MA.
  Unpublished Manuscript.  20 pp.

Rudnick, D.L. 1992.  Cruise Report OC250/3: Subduction experiment.
  University of California, San Diego.  Unpublished Manuscript.
  13 pp.
Appendices
available in written version