


formerly the National Oceanographic Data Center (NODC)... more on NCEI
|
|
|
formerly the National Oceanographic Data Center (NODC)... more on NCEI |
|
NCEI is transitioning to a new website and paths to data resources will be changing. Please contact NCEI.Info@noaa.gov with any questions of issues. See the new website at www.ncei.noaa.gov.
| You are here: Home > Ocean Climate Laboratory > OCL Products > ArcGIS tutorial |
|
How to create a shapefile from 'csvfromwod.c' program output using ArcMap
For additional information, how to work with Excel files in ArcGIS please see ESRI help page. |
| 1. Start ArcMap software.
Select 'A new empty map' on the Start-Up menu. Click 'OK' button. |
| 2. Add your Excel worksheet to ArcMap 9.3 (just as you would spatial data). Go to File. A new popup window should be displayed ... Select 'Add Data' or use the 'Add Data' button  . .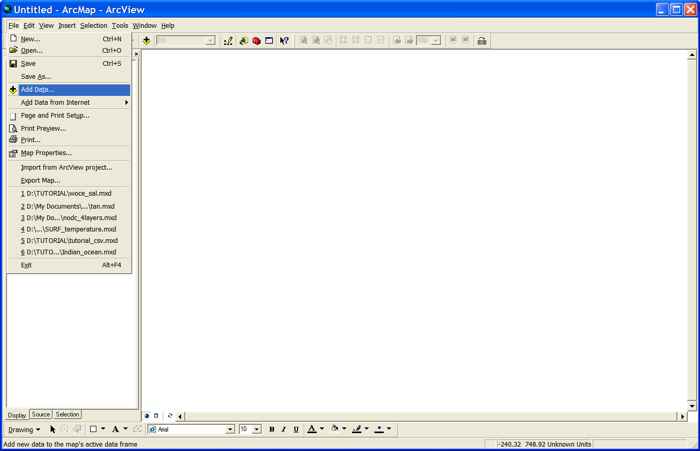 The 'Add Data' popup window should be displayed. Select 'WOD_ArcGIS.csv' file from menu, click 'Add' button. 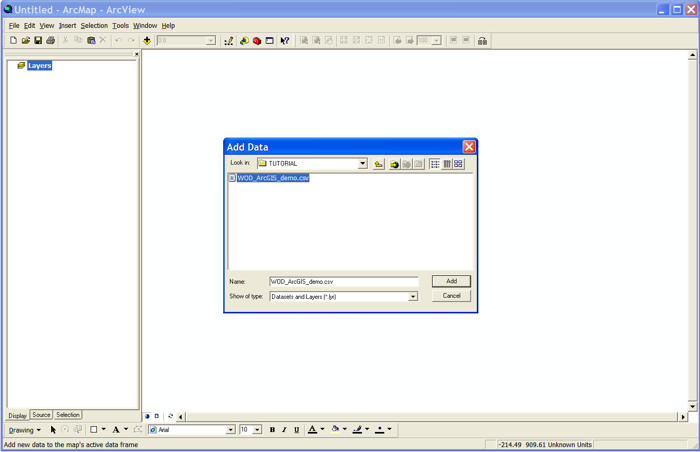 File 'WOD_ArcGIS_demo.csv' will appear in the table of contents (TOC). |
3. Right-click on the worksheet name in the TOC, and choose 'Display XY Data...'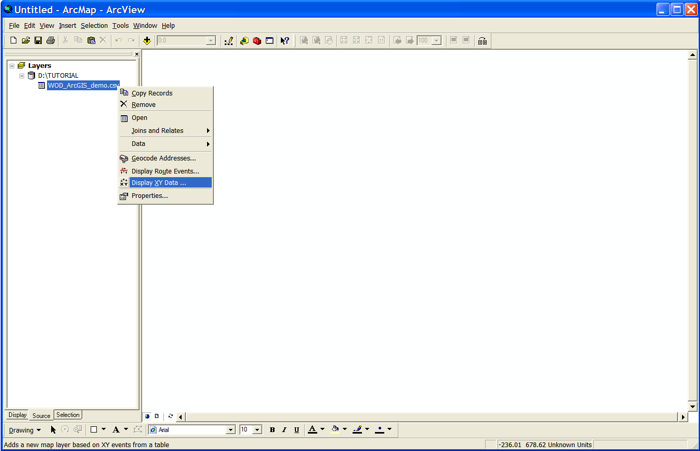 |
In the dialog box 'Display XY Data', the X Field should be Longitude and the Y Field should be Latitude.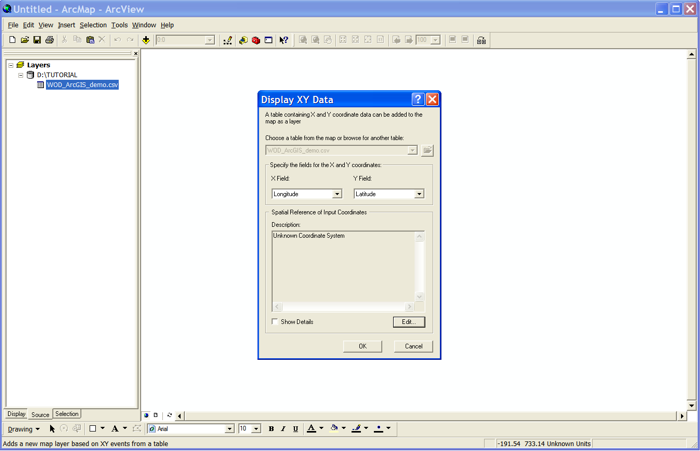 Note: If you know the spatial reference of the input coordinates, click the 'Edit' button -> 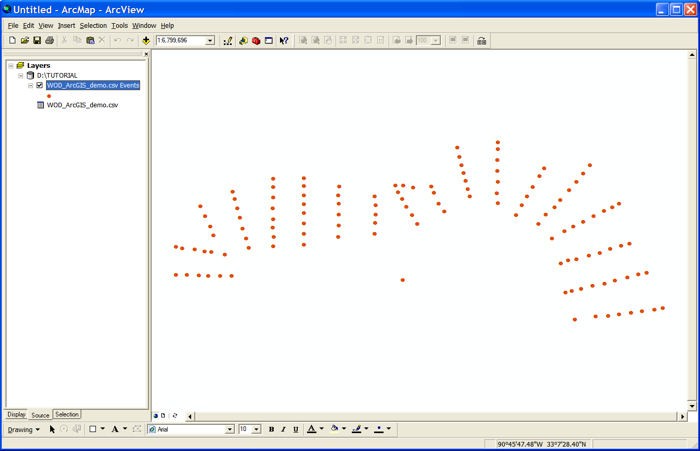 The coordinates will plot as a point event theme. |
| 4. To create a shapefile from the event theme, right-click the layer 'WOD_ArcGIS_demo.csv Events' in the TOC and select 'Data -> Export Data...'. 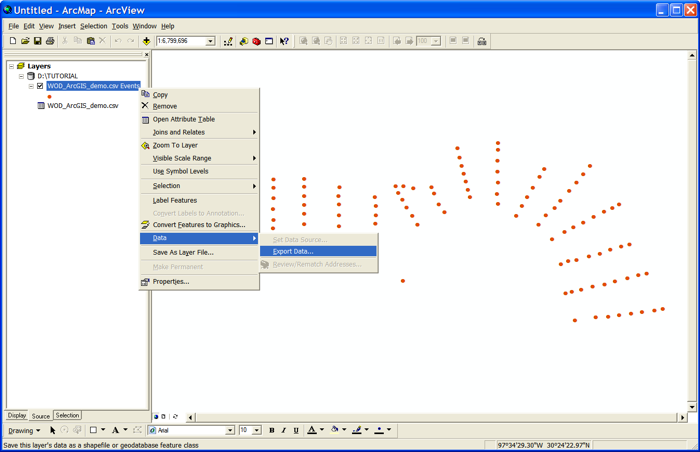 Then select a location for the new shapefile, name it and click OK. 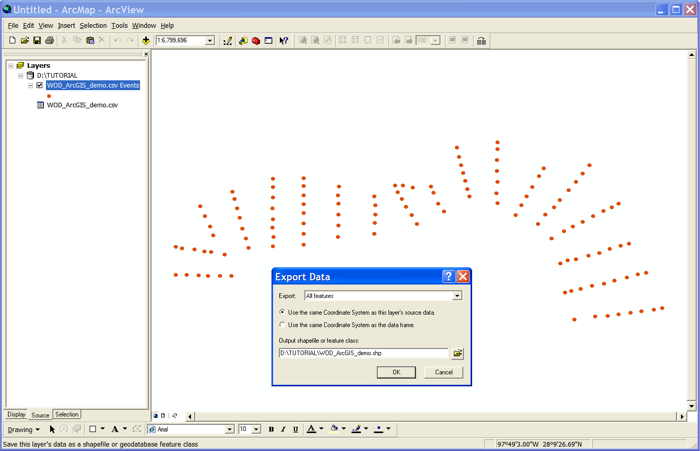 |
Add a World map layer (for better visualization).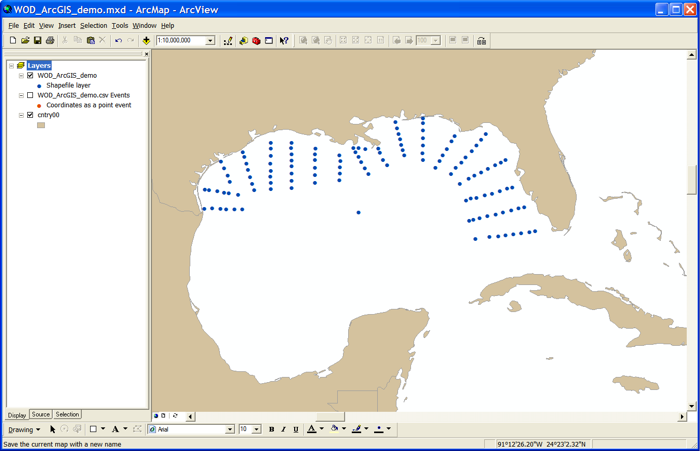 |
| 5. To create a color quantative layer from a shapefile, first, set a Layer Properties . Right-click on the 'WOD_ArcGIS_demo' shapefile name in the TOC. A new popup window should be displayed ... select the last option 'Properties'.  A separate window called Layer Properties ... 'Symbology' tag should be displayed. |
|
6. Setting Show and Field Properties Under Show: section (on the left of the window) select 'Quantities' -> 'Graduated colors' and under the Fields section change the value from 'None' to desired depth level, for example, 'Sal_0m'. Don't worry about the 'Maximum sample size ...' popup being displayed ... just click 'OK'.  |
|
7. Setting Classification Properties Under the Classification section click on Classify ... button in the opened Layer Properties menu. A new Classification window appears that allows you to change how the points will be displayed.  |
|
8. Setting Data Exclusion Properties |
|
9. Setting Interval |
|
10. Setting Symbol Selector Menu At this point you should have the Layer Properties menu still up. Right click on one of the dot symbol next to a range, select 'Properties for All symbols' in the drop-down menu.  A new Symbol Selector window appears that allows you to change the symbology.  In the Symbol Selector window choose black color circle labeled 'Circle 1', change dot size if needed. Click 'OK' button. It will take you back to the Layer Properties menu. All the dots should now have the same black color with no outline. |
|
11. Resetting the Color Scheme Click on the 'Color Ramp', reselect the color scheme you want to use and all the points should be broken into new colors without outlines. 
|
|
12. Add the next depth layer Go to 'File' -> 'Add Data'. Navigate the Add Data window, select 'WOD_ArcGIS.shp' shape file, cleck 'OK' button.  |
|
13. Import Symbology Properties Activate Layer Properties window (Right click on new depth layer, click on 'Properties' in the drop-down menu). In the Layer Properties window under the 'Fields' section select a new level, for example, 'Sal_20m'. Click on 'Import' button under 'Draw quantaties using color to show values' section. It will bring up Import Symbology window. In this window check 'Import symbology definition from another layer in the map ...'. From the 'Layer' drop list choose 'WOD_ArcGIS_demo'. From the 'What do you want to import?' section choose 'Complete symbology definition'. Click 'OK' button. It will bring Import Symbology Map window. In the Import Symbology Map window select 'Sal_20m' under 'Value Field' section. Click 'OK'.  |
A new 'Sal_20m' layer has inhereted all symbology properties from the 'Sal_0m' layer. |
| Last modified: Thu, 23-Apr-2015 19:57 UTC | NCEI.info@noaa.gov | ||
|
Freedom of Information Act (FOIA)
USA.gov - The U.S. Government's Web Portal
|
|||


