Step by step instructions
on uploading the WOAselect shape files in to ArcMap software
We would like to thank Betsy Schenck-Gardner of the
NCDDC for providing us with the
initial instructions
|
|
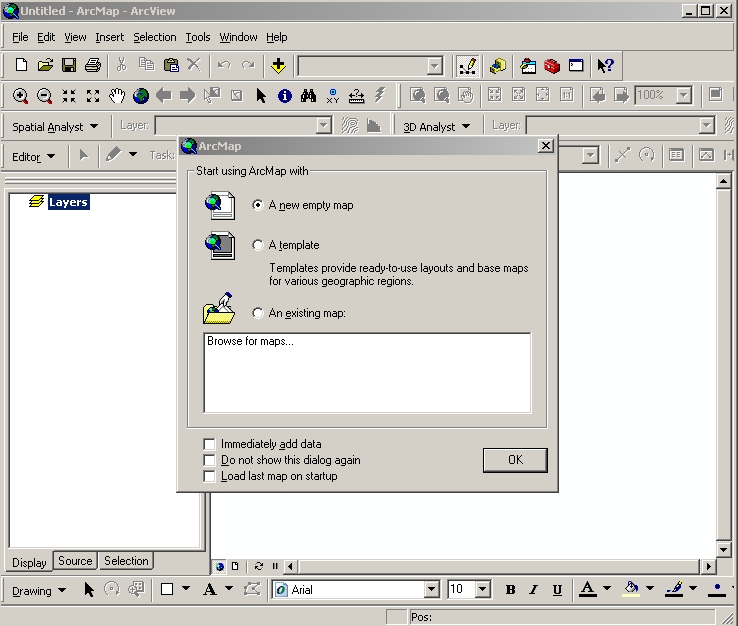
1. Starting ArcMap
Start ArcMap software.
Select 'A new empty map' on the Start-Up menu. Click 'OK' button.
|
|
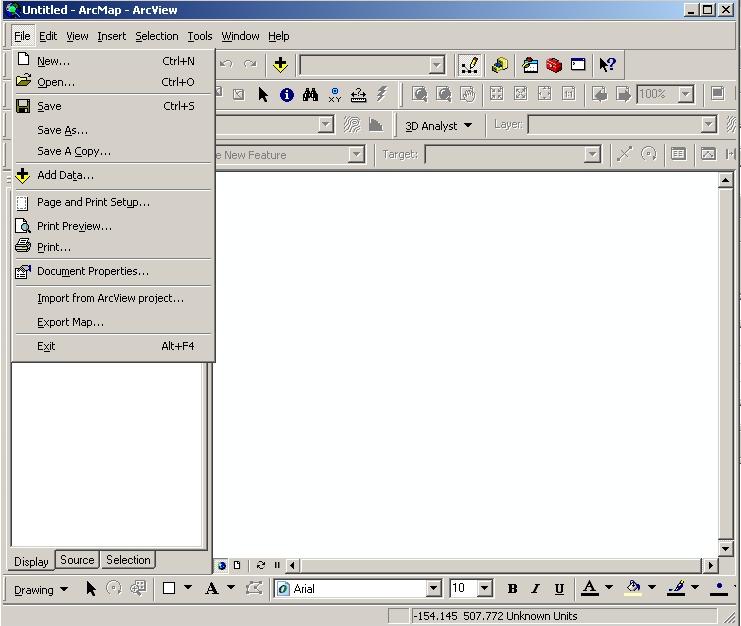
2. Adding Data Window
ArcMap File Menu Screen
From the 'File' option select 'Add Data'.
|
|
3. Adding Data Popup Window
The application will open a new window that allows you to navigate
to your data and add it to the map.
Select the 'nodc.shp' file and click 'OK'.
You might get an additional window saying 'Unknown Spatial Reference'.
Don't worry about it just click 'OK' again.
|
|
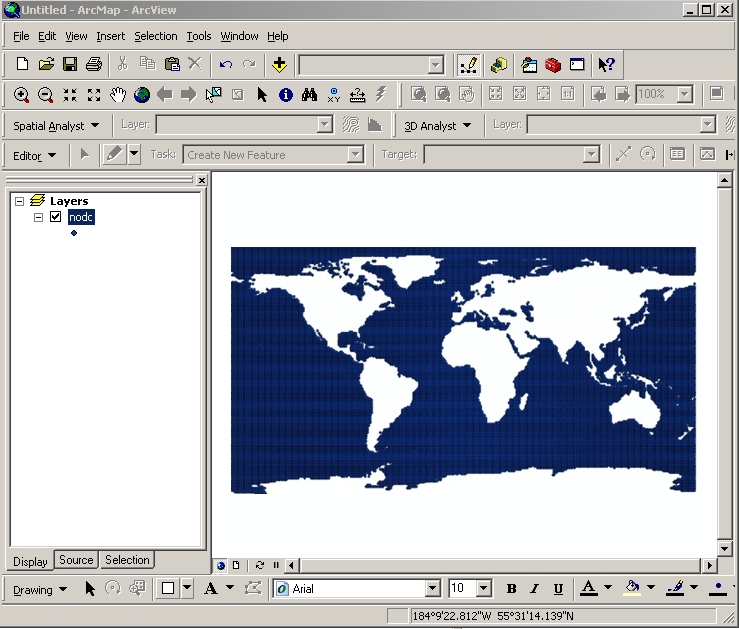
4. ArcMap Display
On your screen, you should see a whole cluster of dots in the map.
|
|
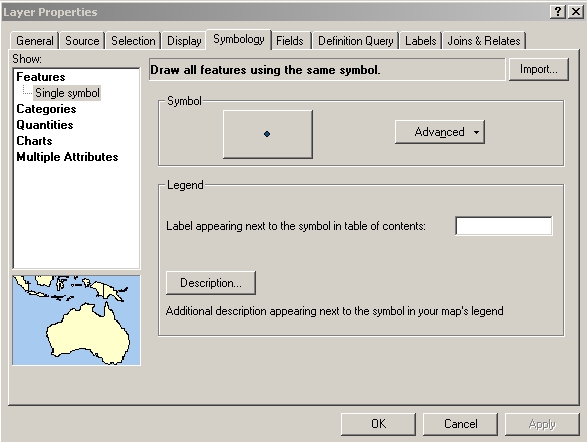
5. Setting Layer Properties
Position your cursor over the nodc name listed under 'Layers', i.e., place cursor over the text, then
hit your right mouse button.
A new popup window should be displayed ... select the last option 'Properties'.
A separate window called Layer Properties ... 'Symbology' tag should be displayed.
|
|
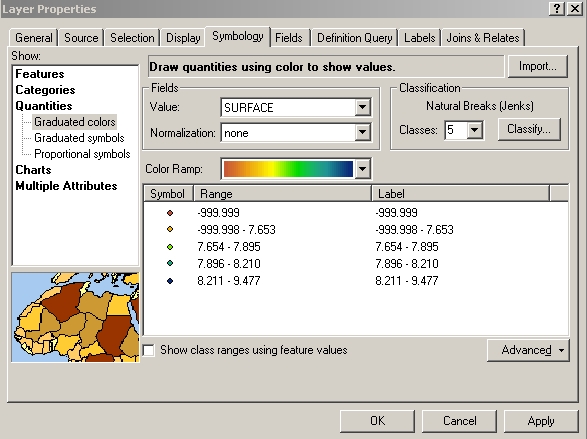
6. Setting Show and Field Properties
Select 'Quantities' under Show: (on the left of the window) and
change the value from 'None' to 'SURFACE' under
the Fields section.
Don't worry about the 'Maximum sample size ...' popup being displayed ... just click 'OK' button.
|
|
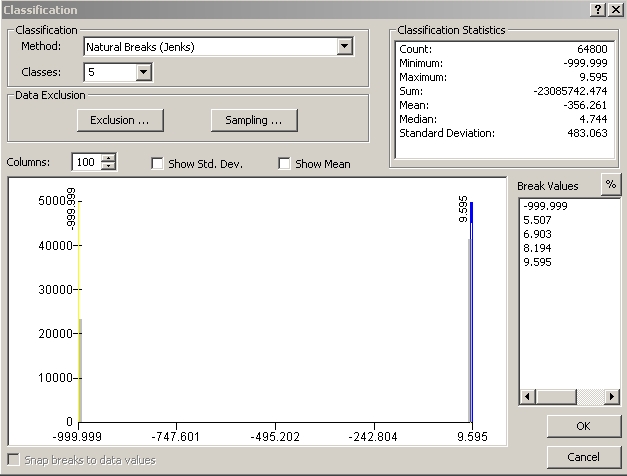
7. Setting Classification Properties
Click on Classify ... button under the Classification section
in the opened Layer Properties menu.
Don't worry about the 'Maximum sample size ...' popup being displayed ... just click 'OK' button.
A new Classification window appears
that allows you to change how the points will be displayed.
|
|
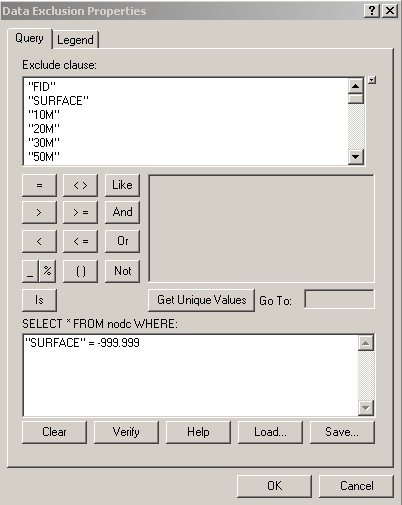
8. Setting Data Exclusion Properties
a. Click on 'Sampling' button under the Data Exclusion section
in the Classification Menu and change
the number from 10000 to 80000. Click 'OK' button.
b. Click on 'Exclusion' button under the Data Exclusion section
in the Classification Menu.
A new Data Exclusion Properties window appears
that allows you set data exclusion properties.
Type in the SELECT * FROM nodc WHERE: section the statement:
"SURFACE" = -999.999
Make sure you use quotation marks where shown! Click 'OK'.
|
|
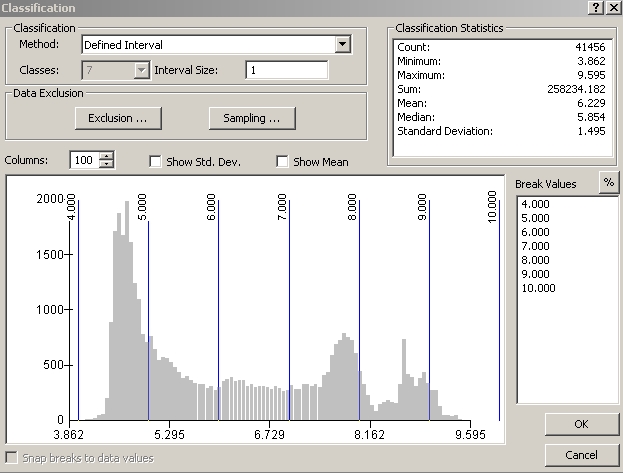
9. Setting Interval
Set the Method to be 'Defined Interval' and the Interval Size equal to 1 under the Classification section
in the Classification Menu.
Click 'OK'.
|
|
10. Setting Symbol Selector Menu
At this point you should have the Layer Properties menu still up.
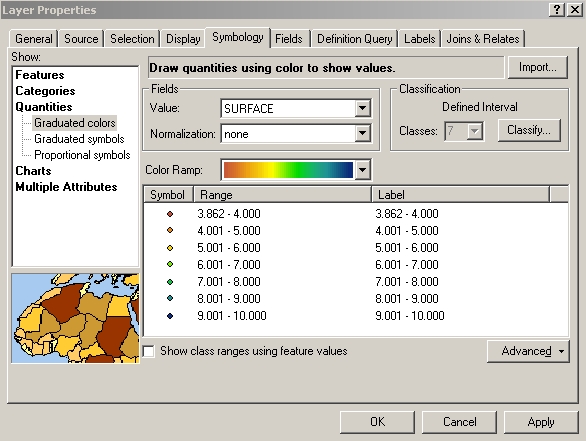
Double click on one of the dot symbol next to a range.
A new Symbol Selector window appears that allows you to change the symbology.
|
|
11. Setting Symbol Outline Properties
a. This step shows you how to turn off outline of a single selected symbol
Click on 'Properties'
in the Symbol Selector Menu.
In the Symbol Property Editor menu that popups, unselect 'Use Outline'.
Click 'OK' in the Symbol Selector menu.
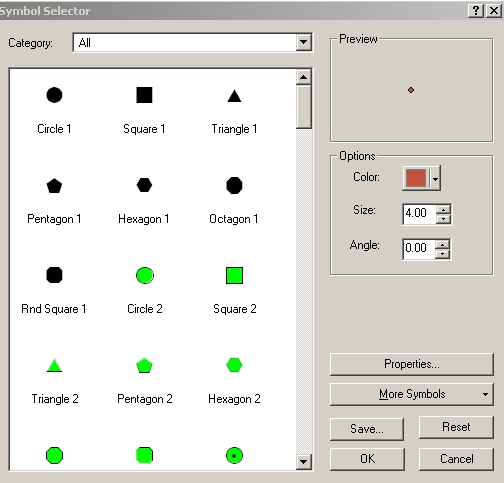
It will take you back to the Layer Properties menu.
The outline has been turned off of just that dot you select, i.e.,
no black line around the colored dot.
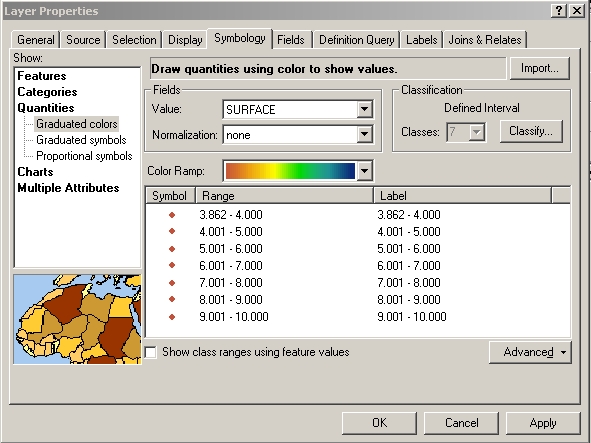
b. Next step, you want all the other dots to not have outlines
Right click on the dot you just made settings for and select 'Properties for All Symbols'.
This takes you back to the Symbol Selector Menu.
Click on 'Properties' button
in the Symbol Selector Menu.
In the Symbol Property Editor menu that popups, Click 'OK'.
Click 'OK' in the Symbol Selector menu.
All the dots should now have the same color with no outline.
|
|
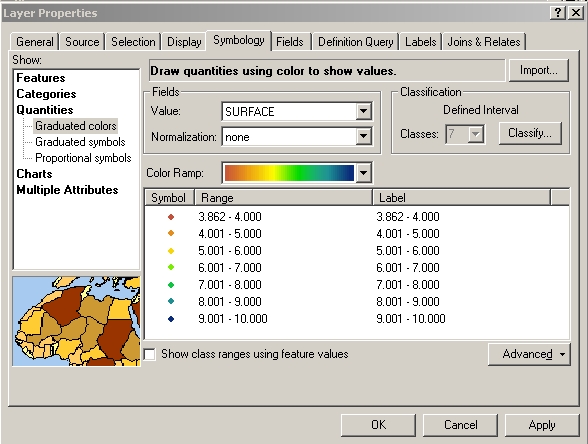
12. Resetting the Color Scheme
Click on the 'Color Ramp', reselect the color scheme you want to use
and all the points should be broken into new colors without outlines.
|
|
13. Plot Final Map
Click 'OK'. You should see the surface values of dissolved oxygen
broken into 1 unit ranges.
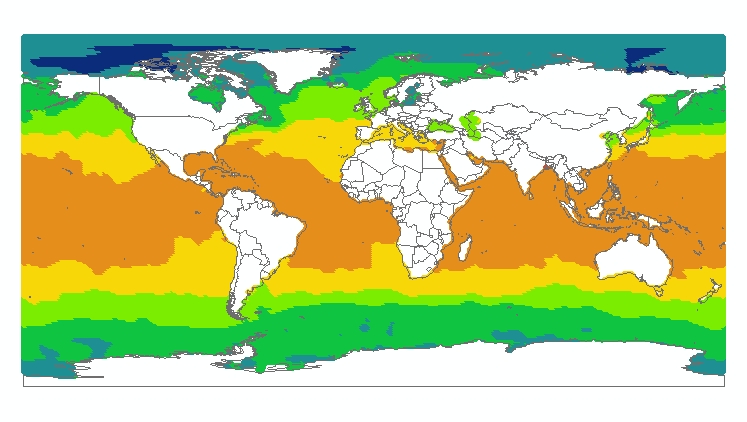
If you want to plot a different depth of values. Repeat steps 2 - 13 for different depth.
|
|
Note: To obtain a grid from a point file in ArcGIS, you need to go to the ArcToolbox, and under 'Conversion Tools', 'To Raster',
you will find a 'Point to Raster' that enables you to transform it into a grid.
|


