A compiled data product of profile, discrete biogeochemical measurements from 35 individual cruise data sets collected from a variety of ships in the southern Salish Sea and northern California Current System (Washington state marine waters) from 2008-02-04 to 2018-10-19
by Simone R. Alin1, Jan Newton2, Dana Greeley1, Beth Curry2, Julian Herndon3, Alex Kozyr4 and Richard A. Feely1
1Pacific Marine Environmental Laboratory, National Oceanic and Atmospheric Administration, Seattle, Washington, USA
2Applied Physics Laboratory, University of Washington, Seattle, Washington, USA
3Cooperative Institute for Climate, Ocean, and Ecosystem Studies, University of Washington, Seattle, Washington, USA
4National Centers for Environmental Information, National Oceanic and Atmospheric Administration, Silver Spring, Maryland, USA
OCADS Project Metadata Page
![]() Database Files (Please see Copyright and Fair Data Use information at the bottom of this page)
Database Files (Please see Copyright and Fair Data Use information at the bottom of this page)
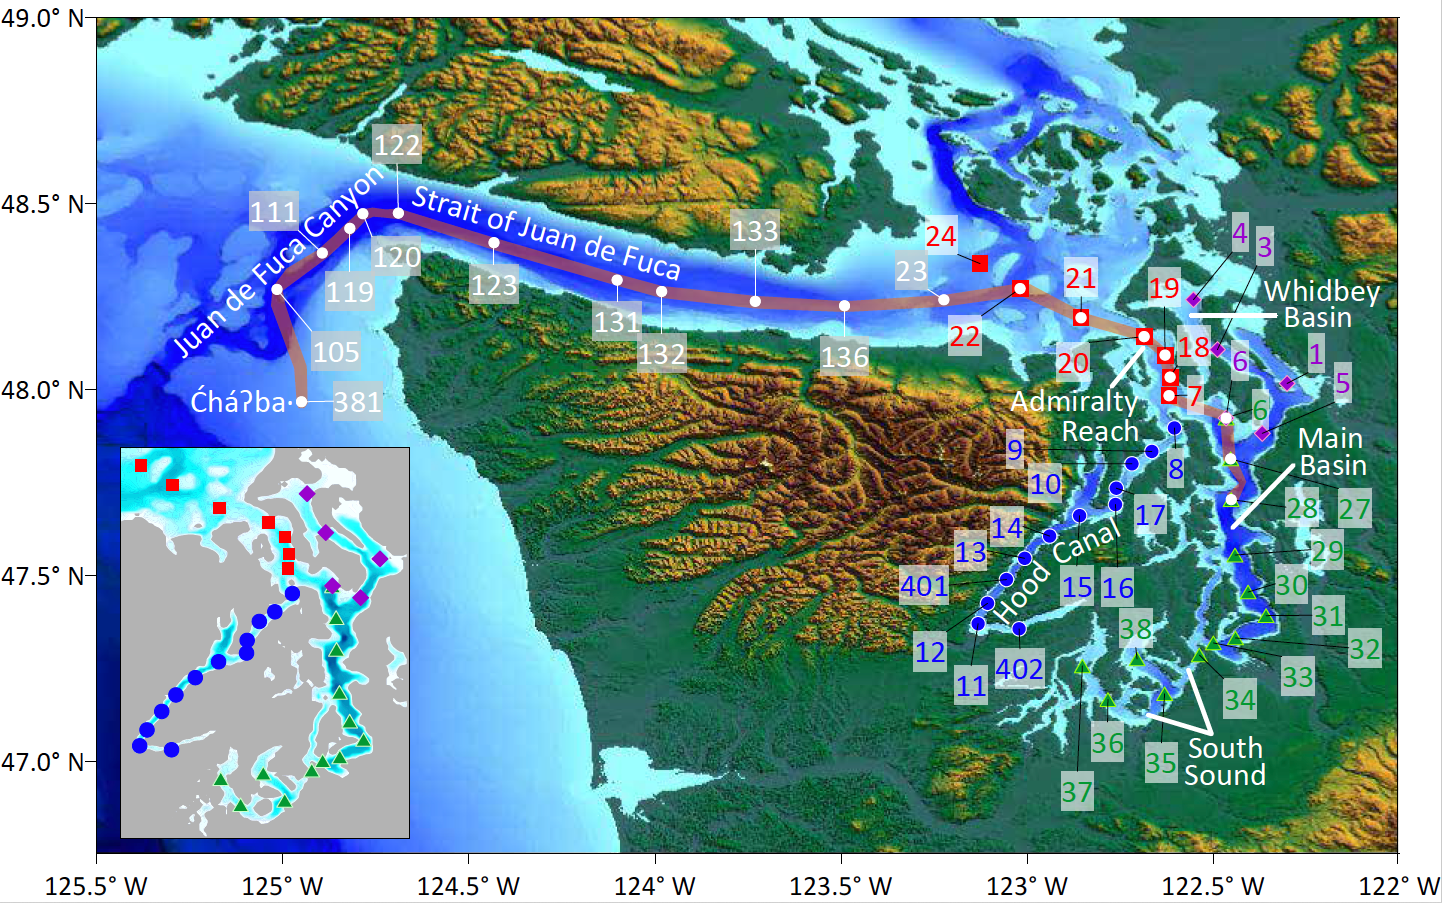
Figure caption
Map of study area, with regions coded using different symbols and cruise station numbers included. “Puget Sound” cruises cover these areas of the southern Salish Sea: Admiralty Reach (red squares), Hood Canal (blue circles), Whidbey Basin (purple diamonds), and Main Basin and South Sound (green triangles, with South Sound stations being 34–38). “Sound-to-Sea” cruises occupied some or all of the stations along the red line (white circles). In some publications, these station numbers are given with a preceding “P”—the station numbers are identical, however (see the NANOOS Salish Cruise app Map tab for full station name information: http://nvs.nanoos.org/CruiseSalish).
Abstract
Acidification patterns in coastal and estuarine environments are challenging to characterize and attribute using moored time-series alone because lateral,
depth, and time patterns are complex and have multiple drivers, including circulation, biology, regional weather, and large-scale climate oscillations. Cruise
time-series can provide spatial context to data sets with higher temporal resolution, provide invaluable validation for numerical simulations, and frame biological
experiments and observations with information about relevant environmental complexity. This time-series of 35 cruise data sets (See Table below) extending through
the southern Salish Sea and into Washington’s northern coastal waters spans the years 2008–2018, including strong ocean condition anomalies, with sampling depths
from the seawater surface to near-bottom water masses. Two predominant sampling patterns are present across the cruises: 1) Puget Sound cruises sampled all basins
within the sound and across the sill at its inlet (Admiralty Reach). These cruises have recurred regularly in April, July, and September since 2014. 2) “Sound-to-Sea”
cruises, associated with servicing the Ćháʔba· ocean acidification mooring off La Push, Washington, sample at a suite of CTD stations located between Seattle (located
just east of where the Main Basin line ends on the map) and the mooring site off the coast, occurring most frequently in May and October. A subset of stations (7, 22, and 28)
belong to both Puget Sound and Sound-to-Sea cruises. Biological sample collection has also been conducted regularly since 2014 at a subset of stations (in the
Salish Sea: 4, 8, 12, 22, 28, 38, 402, and on the coast at station 381), although biological data are not included in the data products described here. Observations
included in the Salish cruise data product are bottle sample analyses of total alkalinity, dissolved inorganic carbon, nutrient (nitrate, nitrite, ammonium, phosphate, silicate),
and oxygen content (µmol per kg units); and CTD sensor measurements of temperature, salinity (via conductivity), and oxygen content at bottle sample depths where Niskin bottles
collected seawater. Oxygen and nutrient data are also provided in concentration units (mg per L) to facilitate data uptake by biology end users, and oxygen data are provided
in mL per L units as well. This data product captures the long-lasting effects of the Northeast Pacific marine heatwave of 2013–2015 and the El Niño of 2015–2016 on the
temperature profiles of the southern Salish Sea, with contemporaneous changes in inorganic carbon, oxygen, and nutrient content. Further details on methods and findings
from the Salish cruise time-series are presented in publications. This time-series from cruises in Washington’s estuarine
and coastal waters is known collectively as “the Salish cruises,” and end users are encouraged to use the most recent full data product files available via the Database
Files link above, as the individual cruise data files linked in Table 1 may not have received all QC updates described in the Alin et al. ESSD publication below. Users
can also access full-resolution data (0.5 db depth bins) from CTD downcasts corresponding to the CTD upcast data collected with discrete bottle samples for Salish cruises,
including those dating back to 1998, at http://nvs.nanoos.org/CruiseSalish.
Three subsets of the data product are available on the Index page accessed by clicking the Database Files link above the map:
1) Filename “SalishCruise_dataProduct_2008to2018_09202023_CO2calcs.csv” contains the smallest subset of the data product, consisting of 3971 complete records of DIC, TA, T, S, O2,
and nutrient measurements with the highest quality QC flags (QC=2, or “acceptable”), ready for calculations of the full carbonate system; this file is recommended for end users
without strong familiarity with QCing or interpolating biogeochemical data.
2) Filename “SalishCruise_dataProduct_2008to2018_09202023_questNut.csv” contains additional samples with nutrient data that require further QC attention (total of 4021 paired
observations); all other data have “acceptable” QC flags (=2).
3) Filename “SalishCruise_dataProduct_2008to2018_09202023_allData.csv” contains the most complete version of the Salish cruise data product, including all data with
“questionable” QC flags (=3) and data gaps for users with the capacity for or interest in interpolating to fill data gaps. The total number of observations in this file is 7525.
An Excel file with updated metadata, including a tab detailing changes since the previous version of the data product on the NCEI page, is also available via the Index page
(“SalishCruise_dataProduct_2008to2018_metadata_09202023.xlsx”).
Table 1. Access to cruise-level archived metadata and data files at NCEI for all Salish Sea cruises featuring inorganic carbon measurements led by the University of Washington and NOAA Pacific Marine Environmental Laboratory investigators shown above. We recommend visiting each OCADS page link to see a map of stations sampled on each individual cruise, as well as most appropriate citations to use for individual cruise data sets. Click the "Download data" button to download copies of data and metadata files on this page for the compiled data package or on individual cruise pages for the data/metadata for individual cruises. If your application involves an en masse application of the data, please cite this data product as suggested below. Many frequently asked questions about these cruises can be answered by reading the metadata.
Please cite any one or few data sets you use individually (see table above for links) or if used en masse, cite the data set as:
Alin, Simone R.; Newton, Jan; Greeley, Dana; Curry, Beth; Herndon, Julian; Kozyr, Alex; Feely, Richard A. (2021). A compiled data product
of profile, discrete biogeochemical measurements from 35 individual cruise data sets collected from a variety of ships in the southern Salish
Sea and northern California Current System (Washington state marine waters) from 2008-02-04 to 2018-10-19 (NCEI Accession 0238424).
NOAA National Centers for Environmental Information. Dataset. https://doi.org/10.25921/zgk5-ep63.
Publications
Alin, Simone R.; Newton, Jan A.; Feely, Richard A.; Greeley, Dana; Curry, Beth; Herndon, Julian; and Warner, Mark. (2023, in review). A decade-long cruise time-series (2008–2018) of physical and biogeochemical conditions in the southern Salish Sea, North America. Earth Systems Science Data Discussions. Paper ID: ESSD-2023-239.Alin, Simone R.; Newton, Jan; Feely, Richard A.; Siedlecki, Samantha; and Greeley, Dana. (2023, to be submitted). Seasonality and response of ocean acidification and hypoxia to major environmental anomalies in the southern Salish Sea, North America (2014–2018). Biogeosciences Discussions. Paper ID: To be updated when available.
Acknowledgments
We acknowledge that the land our laboratories are located on has been the home of Coast Salish people since time immemorial and that our study area encompasses the traditional and ancestral waters of the Coast Salish peoples and the Coastal Treaty Tribes of Washington. This time-series from cruises in Washington’s estuarine and coastal waters (collectively, “the Salish cruises”) was supported by The University of Washington, Puget Sound Regional Synthesis Model (PRISM), Northwest Association of Networked Ocean Observing Systems (NANOOS), Washington Ocean Acidification Center (WOAC), National Oceanic and Atmospheric (NOAA) Pacific Marine Environmental Laboratory, NOAA Ocean Acidification Program, and the U.S. Integrated Ocean Observing System. Further cruises from the Salish cruise time-series will be added to this table after submission to NOAA National Centers for Environmental Information. This is PMEL contribution # 5265. This publication was partially funded by the Joint Institute for the Study of the Atmosphere and Ocean (JISAO) under NOAA Cooperative Agreement NA15OAR4320063, Contribution No. 2021-1147.
COPYRIGHT AND FAIR DATA USE
Copyright — These data were produced by NOAA and the Washington Ocean Acidification Center (WOAC) and are not subject to copyright protection in the United States. NOAA and WOAC waive any potential copyright and related rights in these data worldwide through the Creative Commons Zero 1.0 Universal Public Domain Dedication (CC0-1.0).
Fair Data Use request from data producers — Data from the Salish cruises are made freely available to the public and the scientific community in the belief that their wide dissemination
will lead to greater understanding and new scientific and policy insights. The investigators sharing these data rely on the ethics and integrity of the user to ensure that the institutions
and investigators involved in producing the Salish cruise data sets receive fair credit for their work, which in turn helps ensure the continuity of the observational time-series. If the
data are obtained for potential use in a publication or presentation, we urge the end user to inform the investigators at the outset of this work so that we can help ensure that the quality
and limitations of the data are accurately represented. If these data are essential to the work, or if an important result or conclusion depends on these data, co-authorship may be appropriate;
this should be discussed at an early stage in the work. We request that manuscripts using these data be shared before they are submitted for publication. Please direct all queries about this
data set to Dr. Simone Alin (simone.r.alin@noaa.gov) and Dr. Jan Newton (janewton@uw.edu).