NDP-092 (2013)
ORNL/CDIAC-159
Download the PACIFICA Data Products
Download the PACIFICA Original Cruise Data Files
Download  of NDP-092
PACIFICA DATA SYNTHESIS PROJECT
By the PACIFICA Group:
Toru Suzuki,1 Masao Ishii,2 Michio Aoyama,2 James R. Christian,3 Kazutaka Enyo,4 Takeshi Kawano,5 Robert M. Key,6 Naohiro Kosugi,2 Alex Kozyr,7 Lisa A. Miller,8 Akihiko Murata,5 Toshiya Nakano,4 Tsuneo Ono,9 Toshiro Saino,5 Ken-ichi Sasaki,10 Daisuke Sasano,2 Yusuke Takatani,4 Masahide Wakita ,10 Christopher L. Sabine,11Prepared by
Toru Suzuki (Marine Information Research Center, Japan Hydrographic Association, Japan)and
Alex Kozyr (Carbon Dioxide Information Analysis Center, Oak Ridge National Laboratory, Oak Ridge, Tennessee, U.S.A.)
1Marine Information Research Center, Japan Hydrographic Association, Japan
2Geochemical Research Department, Meteorological Research Institute, Japan Meteorological Agency, Japan
3Fisheries and Oceans Canada, Canadian Centre for Climate Modelling and Analysis, Canada
4Global Environment and Marine Department, Japan Meteorological Agency, Japan
5Research Institute for Global Change, Japan Agency for Marine-Earth Science and Technology, Japan
6Atmospheric and Oceanic Sciences, Princeton University, USA
7Carbon Dioxide Information Analysis Center, Oak Ridge National Laboratory, US DOE, USA
8Institute of Ocean Sciences, Fisheries and Oceans Canada, Canada
9National Research Institute of Fisheries Sciences, Fisheries Research Agency, Japan
10Mutsu Institute for Oceanography, Japan Agency for Marine-Earth Science and Technology, Japan
11Pacific Marine Environmental Laboratory, NOAA, USA
Contents
- ABBREVIATIONS AND ACRONYMS
- ABSTRACT
- 1. INTRODUCTION
- 2. DATA COLLECTION, CONVERSION AND PRIMARY QUALITY CONTROL
- 3. SECONDARY QUALITY CONTROL
- 4. DATA AND PRODUCTS
- 5. ASKNOWLEDGEMENTS
- 6. HOW TO OBTAIN THE DATA AND DOCUMENTATION
- 7. REFERENCES
ABBREVIATIONS AND ACRONYMS
| AOU | Apparent Oxygen Utilization | |
| ALKALI | Total Alkalinity | |
| CARBOOCEAN | Marine carbon sources and sinks assessment | |
| CARINA | Carbon in the Atlantic Ocean | |
| CCHDO | CLIVAR and Carbon Hydrographic Data Office | |
| CDIAC | Carbon Dioxide Information Analysis Center | |
| CFCs | Chlorofluorocarbons | |
| CLIVAR | Climate Variability (Program) | |
| GLODAP | Global Ocean Data Analysis Project | |
| ICSU | International Council for Science | |
| IOC | Intergovernmental Oceanographic Commission | |
| IODE | International Oceanographic Data and Information Exchange | |
| JAMSTEC | Japan Agency for Marine-Earth Science and Technology | |
| JGOFS | Joint Global Ocean Flux Study | |
| JMA | Japan Meteorological Agency | |
| JODC | Japan Oceanographic Data Center | |
| KNOT | Kyodo Northwestern Pacific Ocean Time series | |
| MRI | Meteorological Research Institute | |
| NITRAT | Nitrate | |
| NO2+NO3 | Nitrate and Nitrite | |
| NODC | National Oceanographic Data Center | |
| NOPACCS | Northwest Pacific Carbon Cycle Study (1990-1996) | |
| NPPS | North Pacific Process Study | |
| OXYGEN | Dissolved Oxygen | |
| PHSPHT | Phosphate | |
| PICES | North Pacific Marine Science Organization | |
| PICNIC | PICES CO2 Related Data Integration for the North Pacific | |
| S-CC | Section on Carbon and Climate | |
| SALNTY | Salinity | |
| SILCAT | Silicate | |
| TCARBN | Total carbon (dissolved inorganic carbon) | |
| WDS | World Data System | |
| WEST-COSMIC | Western Pacific Environmental Assessment Study on CO2 Ocean Sequestration for Mitigation of Climate Change (1997-2001) | |
| WOCE | World Ocean Circulation Experiment |
ABSTRACT
Suzuki, T., M. Ishii, M. Aoyama, J. R. Christian, K. Enyo, T. Kawano, R. M. Key, N. Kosugi, A. Kozyr, L. A. Miller, A. Murata, T. Nakano, T. Ono, T. Saino, K. Sasaki, D. Sasano, Y. Takatani, M. Wakita and C. Sabine. 2013. PACIFICA Data Synthesis Project. ORNL/CDIAC-159, NDP-092. Carbon Dioxide Information Analysis Center, Oak Ridge National Laboratory, U.S. Department of Energy, Oak Ridge, Tennessee. doi:10.3334/CDIAC/OTG.PACIFICA_NDP092
PACIFICA (PACIFic ocean Interior CArbon) was an international collaborative project for the data synthesis of data on ocean interior carbon and its related parameters in the Pacific Ocean. The North Pacific Marine Science Organization (PICES), Section on Carbon and Climate (S-CC) supported the project. We have merged hydrographic/hydrochemical datasets from a total of 272 cruises, including those from cruises conducted between the late 1980s and 2000 but not included in GLODAP, as well as CLIVAR/CO2 Repeat Hydrography datasets from the 2000s. Adjustments were calculated to account for analytical offsets in dissolved inorganic carbon, total alkalinity, salinity, oxygen, and nutrients (nitrate and nitrite, phosphate, and silicic acid) for each cruise as a result of the secondary quality control procedure, based on crossover analysis using data from deep layers (Tanhua et al., 2010). We also merged a total of 59 adjusted datasets from Line P off the west coast of Canada. Finally, we have produced the adjusted PACIFICA database that consists of datasets from a total of 306 cruises that also includes 34 datasets from WOCE Hydrographic Program cruises in the Pacific Ocean conducted in the 1990s.
The PACIFICA database is available free of charge as a numeric data package (NDP-92) from the Carbon Dioxide Information Analysis Center (CDIAC) and the primary PACIFICA data site at pacifica.pices.jp. The NDP consists of the original cruise data files, adjusted data product, and this documentation, which describes the PACIFICA project..
Keywords: PACIFICA, dissolved inorganic carbon, total alkalinity, nutrients, dissolved oxygen, WOCE, GLODAP, CLIVAR, Pacific Ocean
1. INTRODUCTION
PACIFICA (PACIFic ocean Interior CArbon) is a data synthesis project for ocean interior carbon and its related parameters in the Pacific Ocean. In the past, the GLODAP (Global Ocean Data Analysis Project) data synthesis generated a unified data set from many different cruises during the 1990s, in order to help determine the global distributions of both natural and anthropogenic inorganic carbon, along with radiocarbon (Key et al. 2004; Sabine et al. 2005). Following GLODAP, the CARINA (CARbon IN the Atlantic Ocean) data synthesis was part of the European Union's CARBOOCEAN project, beginning in January 2005. The CARINA data product includes data from 188 cruises in the Arctic, Atlantic, and Southern Oceans for which secondary quality control (QC) was performed (Key et al., 2010; Tanhua et al., 2010). In response to these data synthesis projects, the Section on Carbon and Climate that was established in 2005 within the North Pacific Marine Science Organization (PICES) decided at the PICES-XV annual meeting in October 2006, Yokohama, Japan, that they would support a carbon data synthesis project for the interior of the Pacific Ocean.
2. DATA COLLECTION, CONVERSION, AND PRIMARY QUALITY CONTROL
In PACIFICA, hydrographic data taken over the entire Pacific Ocean were assembled. The datasets of the World Ocean Circulation Experiment Hydrographic Program (WHP) and CLIVAR/CO2 Repeat Hydrography/ GO-SHIP cruises conducted in the Pacific Ocean, in which data on carbonate chemistry and related parameters are available, were identified at the CCHDO. Data taken in the other hydrographic research programs were also identified on the basis of PICNIC [the PICES CO2 Related Data Integration for the North Pacific, one of the achievements of PICES Working Group 13 (Oct. 1997 - Oct. 2002) and 17 (Oct. 2003 - Oct. 2005)]. The Meteorological Research Institute (MRI) and the Global Environment and Marine Department of the Japan Meteorological Agency (JMA) have been conducting time series observations on the 137ºE and 165ºE sections in the North Pacific, and have contributed a dataset comprising 80 cruises spanning 1997 - 2008. The Japan Agency for Marine-Earth Science and Technology (JAMSTEC) contributed data sets comprising 46 cruises by R/V Mirai and R/V Kaiyo, including those in the western equatorial Pacific, at time series stations KNOT (Kyodo Northwestern Pacific Ocean Time series) and K2 in the western subarctic Pacific, and in the Arctic Ocean, as well as the large datasets from the basin-wide sections of Repeat Hydrography cruises. PACIFICA also includes 5 other large basin-wide data sets from Repeat Hydrography cruises conducted by teams from the USA and Australia. Furthermore, NOPACCS (NOrthwest PAcific Carbon Cycle Study) has surveyed mainly along the 175ºE section between 1990 and 1996, and WEST-COSMIC (Western Pacific Environmental assessment Study on CO2 Ocean Sequestration for Mitigation of Climate Change) extended the survey area from 130ºE to 175 ºE over 1997 - 2001. Japan Oceanographic Data Center (JODC) has contributed data from 14 cruises. The Line P time series program in the northeast Pacific was started in 1956, and data from 59 cruises conducted in 1985 - 2008 were submitted to PACIFICA. An additional number of cruises by the Japan Fisheries Agency and Fisheries Research Agency including A-line time series and by universities were also contributed. As such, datasets from a total of 272 cruises were collected. A subset of these data sets has already been distributed through CDIAC, on DVD-ROM by JGOFS NPPS (North Pacific Process Study), or through the website of the data originator. Other datasets were originally made publicly open by PACIFICA.
Where appropriate, the datasets were converted from their original formats to the WHP- exchange format (Swift and Diggs, 2008). In this process, units of concentration for nutrients and dissolved oxygen were converted to moles per kilogram of seawater, if concentrations had previously been reported in moles (or volume of oxygen) per liter of seawater. The pH scale was converted to “total hydrogen ion concentration scale,” as recommended in the “Guide to best practices for ocean CO2 measurements” (Dickson et al., 2007), if data had previously been reported on other scales. Data sets were inspected for the date, time, and location of sampling, as well as for the range of values and excessive decreases and increases over a depth range (Johnson et al., 2009) (primary QC). Quality flags for bottle samples that have been defined in WHP were assigned, unless data quality information was available in original data sets.
All individual cruises or legs are summarized in the PACIFICA cruise table at http://pacifica.pices.jp/table/ and http://cdiac.ornl.gov/oceans/PACIFICA/ PACIFICA_table.html. New EXPOCODE identifiers have been assigned for all cruises; the EXPOCODE consists of a 2-digit alphernumeric country code and a 2-digit alphanumeric ship code managed by US-NODC (National Oceanographic Data Center), and the date of ship departure for the cruise or first occupation of hydrographic station is represented with 8 digits (Swift and Diggs, 2008). To achieve compatibility with the original data sets, the original cruise number, or old EXPOCODE, was kept in the data file and in the cruise table.
3. SECONDARY QUALITY CONTROL
Secondary QC is an activity to evaluate and correct for offsets in the data caused by imperfect standardization of measurements. Secondary QC of PACIFICA datasets was conducted similarly to CARINA (Tanhua et al., 2010), i.e., in the way the crossover analysis and inversions were processed. The targeted parameters and their minimum adjustments were dissolved inorganic carbon (TCARBN: 4 µmol kg-1), total alkalinity (ALKALI: 6 µmol kg-1), dissolved oxygen (OXYGEN: 1%), nutrients (NITRAT(NO2+NO3), PHSPHT, SILCAT: 2%) and salinity (SALNTY: 0.005). In principle, the minimum depth of data comparisons between cruises at crossover locations was set to 2000 m. However, we also referred to the results from data comparisons below 1500 m for a significant number of non-WHP/CLIVAR cruises for which measurements have only been made down to 2000 m depth. Datasets from a total of 34 WHP cruises in the Pacific in the 1990s that were part of GLODAP were also used for the crossover analysis and inversion. In the inversions, another least-squares model in which the mean latitude of the cruises was not considered as a weighting parameter was also used. The results of inversions were compared among each of the least square models and the GLODAP correction factors. The suggested adjustment values of target parameters were determined for individual cruises and vetted by the working group before implementation.4. DATA AND PRODUCTS
PACIFICA consists of a merged data product, i.e., the database that was subjected to the offset adjustments, as well as the individual cruise data sets that were subjected to 1st level quality control. The PACIFICA data product includes those data from WHP cruises in the Pacific that were included in GLODAP. Corrections are being made, in particular for the case of chlorofluorocarbons (CFCs). Users should always download the latest version of the data sets and merged data product available.
Individual cruise data can be downloaded from the cruise summary table on the PACIFICA primary website, http://pacifica.pices.jp/table/, and cruise summary table at NCEI (PACIFICA table) and data products are available at http://pacifica.pices.jp/data.html and PACIFICA Database. Note that the quality of data taken in the WHP/Repeat Hydrography cruises are usually among the best, but several of them have also been offset-adjusted in the data product as a result of the secondary QC. The individual cruise data also have been exported to CCHDO, JODC, and US-NODC, so that they can be accessed more widely through the IOC/IODE network for oceanographic data exchange and World Data System under ICSU in the future.
The result of secondary QC, i.e., the recommended adjustment values of target parameters for individual cruises or legs, are summarized in the table on the PACIFICA website (http://pacifica.pices.jp/cgi-bin/PACIFICAadjustment.csv). It is worth noting that additive adjustment values have been applied to TCARBN, ALKALI, and SALNTY, while multiplicative adjustment factors have been applied to OXYGEN, NITRAT(NO2+NO3), PHSPHT, and SILCAT. The symbols N/C, N/X, and N/A in the table represent: “not considered in secondary QC”, “no crossover stations is available for secondary QC because all profiles are limited to the top 2000m (or 1500m)” and “no adjustment recommended”, respectively. The flag “C” indicates that the cruise has high-quality data in general and was specified as a core cruise in the inversions. The secondary QC was not performed for the measured pH data, since the number of measurements was deemed too small. The secondary QC for CFC data, according to the method described in Steinfeldt et al. (2010), has yet to be completed.
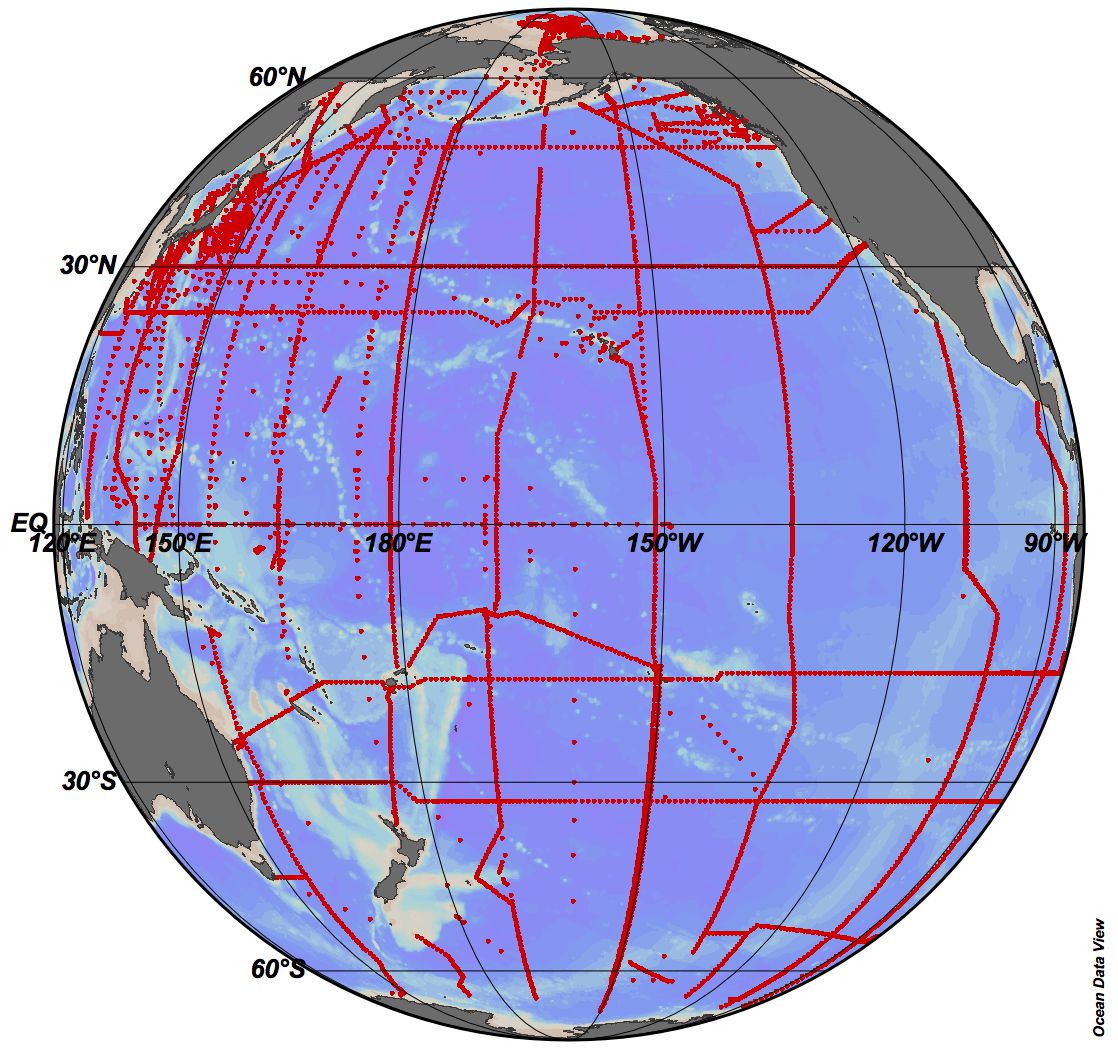
For the convenience of users, the PACIFICA data product was generated as one unified data file that includes adjusted data of the target parameters. In addition, pH on the total hydrogen concentration scale at 25ºC was derived from adjusted TCARBN and ALKALI. The derived pH data have been quality-flagged “0”. Sampling depths in units of meters, apparent oxygen utilization (AOU), potential temperature, and potential density referred to pressures of 0, 1000, 2000, 3000 and 4000 dbar, are also included. Missing values of DEPTH (i.e., unreported ocean bottom depths) were replaced with gridded bathymetry data (JTOPO30v2 (http://www.mirc.jha.jp/products/JTOPO30v2) for the region within 18°N-48°N and 120°E-150°E or GEBCO_08 Grid (http://www.gebco.net/) for other regions) or 10 m below the maximum sampling depth, if gridded bathymetry data was not available. This unified data product has been prepared in a compatible WHP-exchange format so that the Ocean Data View software can import this file as WHP bottle data. In spite of this, two exceptions were added: 1) STNID was generated by concatenation of DATE and TIME, in order to identify stations within cruises; if TIME was blank or missing, STNNBR was added to the end, but the blank was replaced with zero and non-numeric characters were converted by 7 bit decimal ASCII codes (e.g., DATE is '20120506', TIME is blank (i.e. '0000') and STNNBR is 'St.1' (i.e., 'S'=83, 't'=116, '.'=46), then STNID is generated as '20120506000083116461'); and 2) CTDDEPTH was derived from CTDPRS and LATITUDE. Note that when Line P data included SAMPLEDEPTH, which is measured sample depth in meters, as an exception, then it was adopted as CTDDEPTH. The pixel data for each 1º x 1º region for annual, seasonal, and monthly statistical means and standard deviations at standard depths have also been generated on the basis of the unified data product. Figure 1 is the map of PACIFICA station locations.
5. ACKNOWLEDGEMENTS
This work was partly supported by the Global Environment Research Fund by the Ministry of the Environment Japan, D-0803, and MEXT/JSPS KAKENHI Grant 22310017, NOAA Climate Program Office, Ocean Climate Observation Program and the US Department of Energy.
Original Cruise Data Web sites:
PACIFICA table: PACIFICA Table
Japan Meteorological Agency (JMA): http://www.data.kishou.go.jp/kaiyou/db/vessel_obs/data-report/html/ship/ship.php
Japan Agency for Marine-Earth Science and Technology (JAMSTEC): http://www.godac.jamstec.go.jp/cruisedata/e and
http://www.godac.jamstec.go.jp/k2/index.html
Fisheries and Oceans Canada: http://www.pac.dfo-mpo.gc.ca/science/oceans/data-donnees/line-p/index-eng.htm
6. REFERENCES
- Dickson, A. G., C. L. Sabine, and J. R. Christian. (Eds.) 2007. Guide to Best Practices for Ocean CO2 Measurements. PICES Special Publications 3, 191 pp.
- Johnson, D.R., T.P. Boyer, H.E. Garcia, R.A. Locarnini, O.K. Baranova, and M.M. Zweng, 2009. World Ocean Database 2009 Documentation. Edited by S. Levitus. NODC Internal Report 20, NOAA Printing Office, Silver Spring, MD, 175 pp.
- Key, R.M., A. Kozyr, C.L. Sabine, K. Lee, R. Wanninkhof, J. Bullister, R.A. Feely, F. Millero, C. Mordy, T.- H. Peng, A global ocean carbon climatology: Results from Global Data Analysis Project (GLODAP), Global Biogeochem. Cycles, 18, GB4031, doi:10.1029/2004GB002247, 2004.
- Key, R. M., T. Tanhua, A. Olsen, M. Hoppema, S. Jutterström, C. Schirnick, S. van Heuven, A. Kozyr, X. Lin, A. Velo, D. W. R. Wallace, and L. Mintrop, 2010. The CARINA data synthesis project: introduction and overview, Earth Syst. Sci. Data, 2, 105-121.
- Sabine, C. L., R. M. Key, A. Kozyr, R. A. Feely, R. Wanninkhof, F. J. Millero, T.-H. Peng, J. L. Bullister, and K. Lee. 2005. Global Ocean Data Analysis Project: Results and Data. ORNL/CDIAC-145, NDP-083. Carbon Dioxide Information Analysis Center, Oak Ridge National Laboratory, U.S. Department of Energy, Oak Ridge, Tennessee, 110 pp. doi: 10.3334/CDIAC/otg.ndp083
- Steinfeldt, R., T. Tanhua, J. L. Bullister, R. M. Key, M. Rhein, and J. Köhler, 2010. Atlantic CFC data in CARINA. Earth Syst. Sci. Data, 2, 1-15.
- Swift, J. H. and S.C. Diggs. 2008. Description of WHP-Exchange Format for CTD/Hydrographic Data. CLIVAR and Carbon Hydrographic Data Office, UCSD Scripps Institution of Oceanography, 19pp.
- Tanhua, T., S. van Heuven, R. M. Key, A. Velo, A. Olsen, and C. Schirnick. 2010. Quality control procedures and methods of the CARINA database. Earth Syst. Sci. Data, 2. 35-49.
- Tanhua, T., A. Olsen, M. Hoppema, S. Jutterström, C. Schirnick, S. van Heuven, A. Velo, X. Lin, A. Kozyr, M. Alvarez, D.C.E. Bakker, P. Brown, E. Falck, E. Jeansson, C. Lo Monaco, J. Olafsson, F.F. Perez, D. Pierrot, A.F. Rios, C.L. Sabine, U. Schuster, R. Steinfeldt, I. Stendardo, L.G. Anderson, N.R. Bates, R.G.J. Bellerby, J. Blindheim, J.L. Bullister, N. Gruber, M. Ishii, T. Johannessen, E.P. Jones, J. Köhler, A. Körtzinger, N. Metzl, A. Murata, S. Musielewicz, A.M. Omar, K.A. Olsson, M. de la Paz, B. Pfeil, F. Rey, M. Rhein, I. Skjelvan, B. Tilbrook, R. Wanninkhof, L. Mintrop, D.W.R. Wallace, and R.M. Key. 2008. CARINA Data Synthesis Project. ORNL/CDIAC-157, NDP-091. Carbon Dioxide Information Analysis Center, Oak Ridge National Laboratory, U.S. Department of Energy, Oak Ridge, Tennessee. doi:10.3334/CDIAC/otg.ndp091
- Waugh, D.W., T.M. Hall, B.I. McNeil, and R.M. Key. 2006. Anthropogenic CO2 in the oceans estimated using transit-time distributions. Tellus 588:376-389.