OCADSAccess DataSurface / Underway DataLDEO Database V2014Maps of Total Sea-Air CO2 flux from Each 4°x5° Box
Maps of Total Sea-Air CO2 flux from Each 4°x5° Box
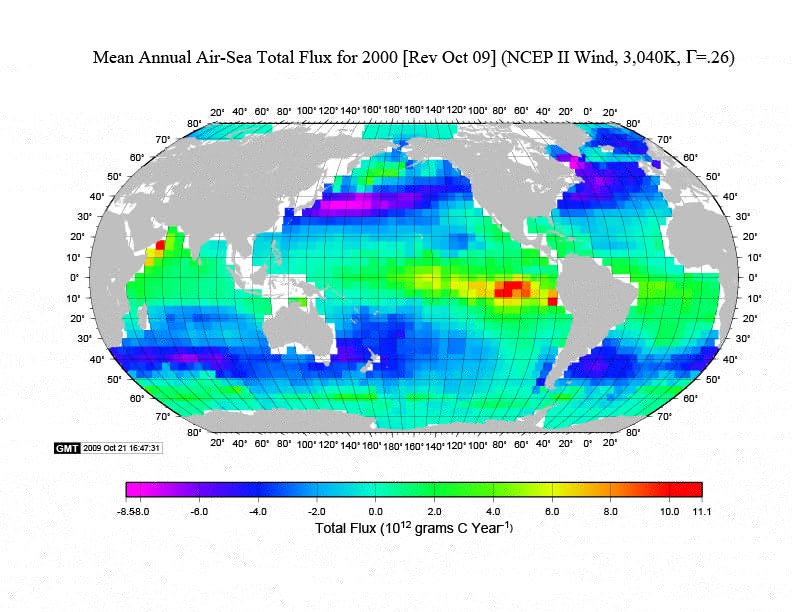
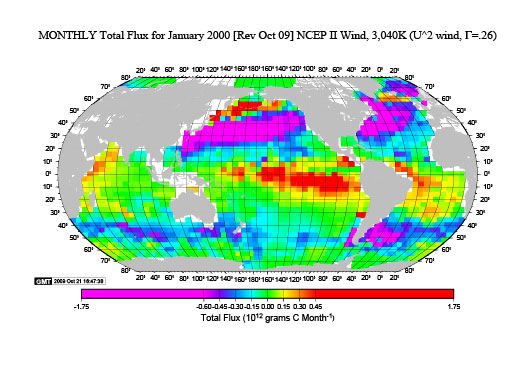
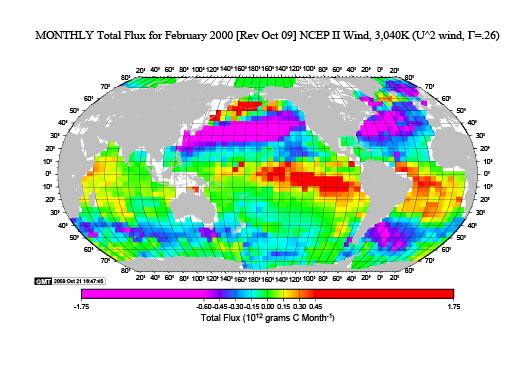
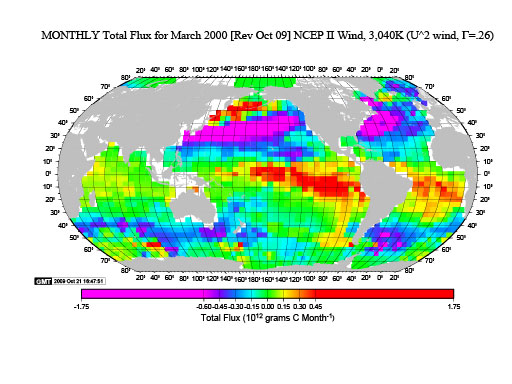
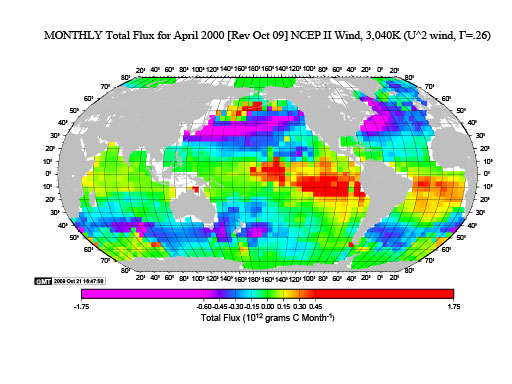
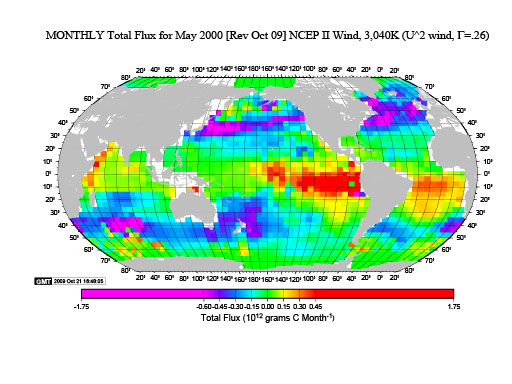
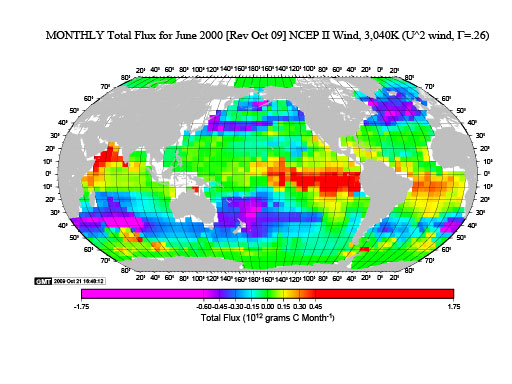
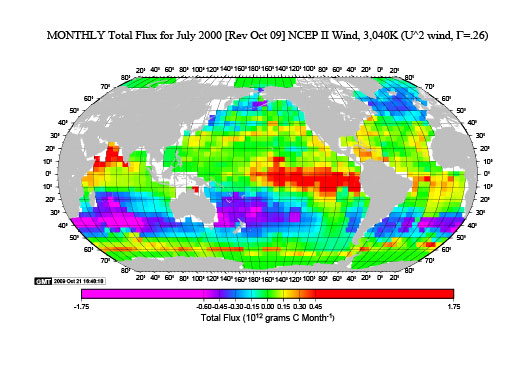
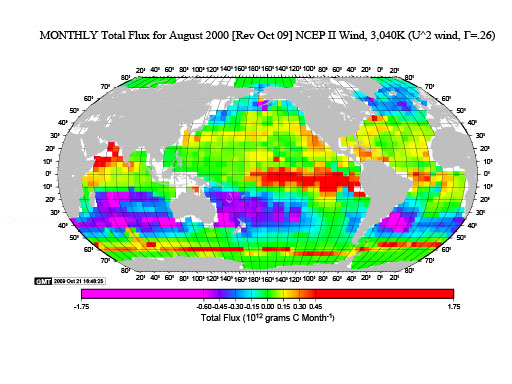
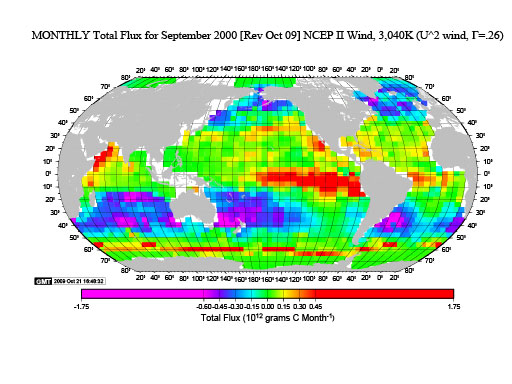
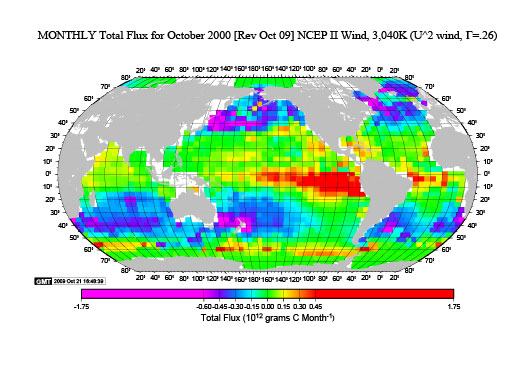
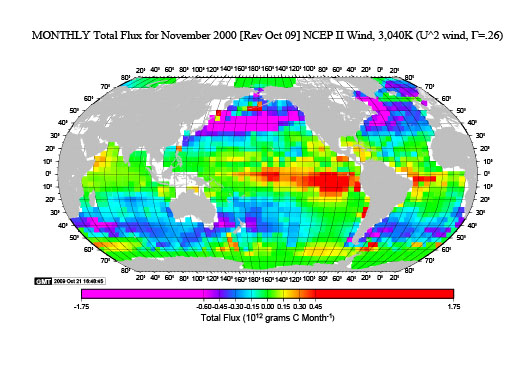
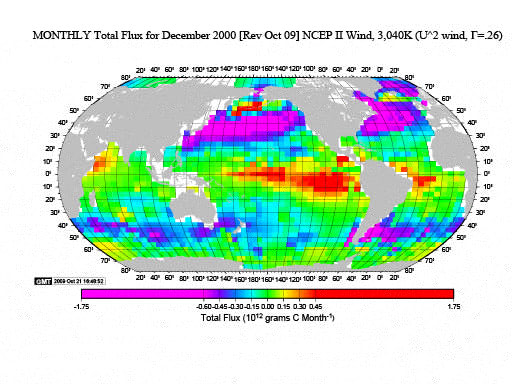
These maps show the total Carbon flux from each 4° latitude x 5° longitude box for each month or each year. For the annual map, the unit is 1012 grams Carbon per year from each box. For the monthly maps the unit is 1012 grams Carbon per month from each box. Essentially this is the flux per unit area multiplied by the area of each box. (Revised October 2009).
 |
|
 |
 |
 |
 |
 |
 |
 |
 |
 |
 |
 |
 |
Last modified: 2021-03-17T18:30:21Z