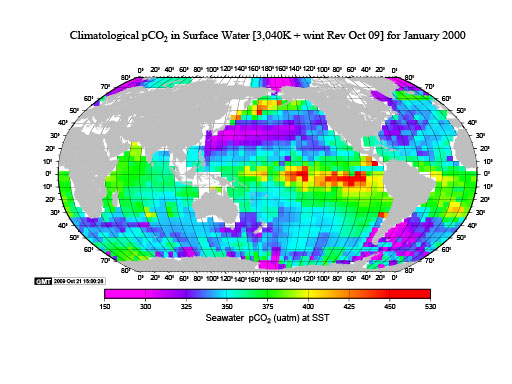
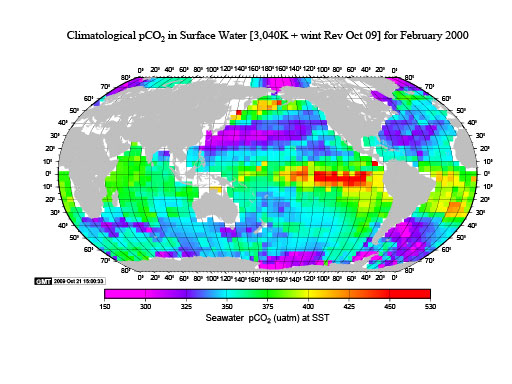
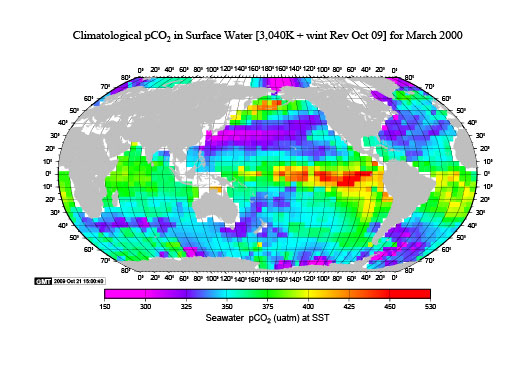
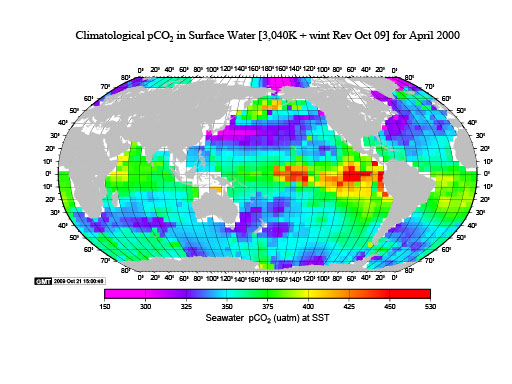
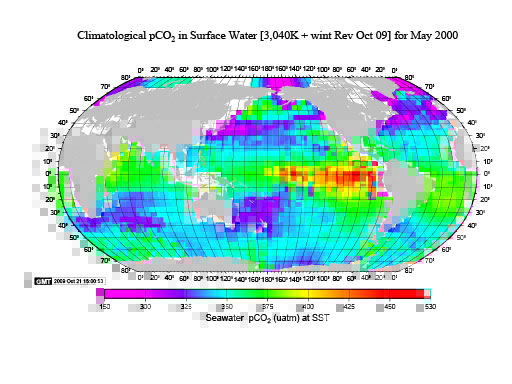
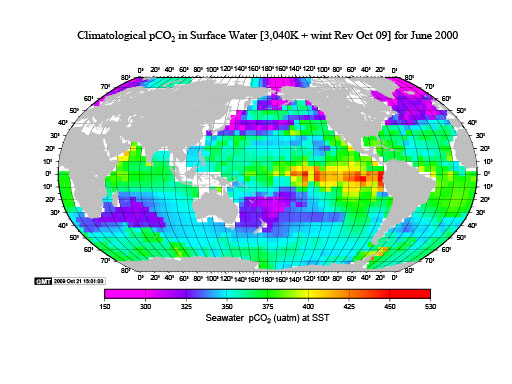
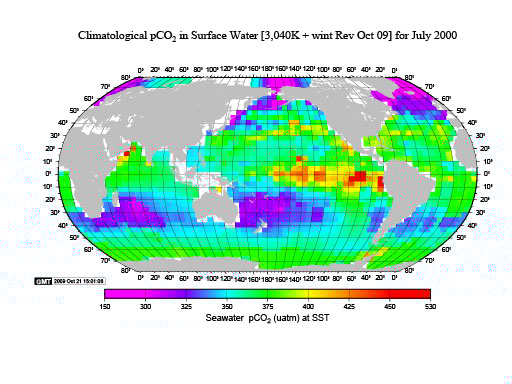
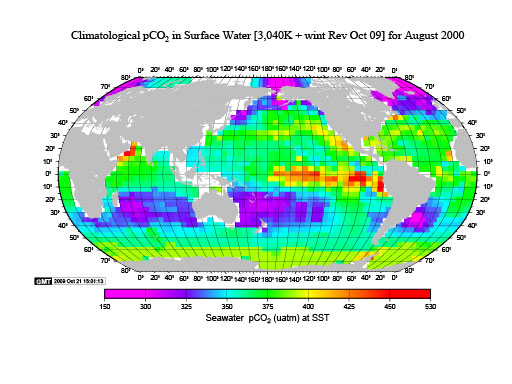
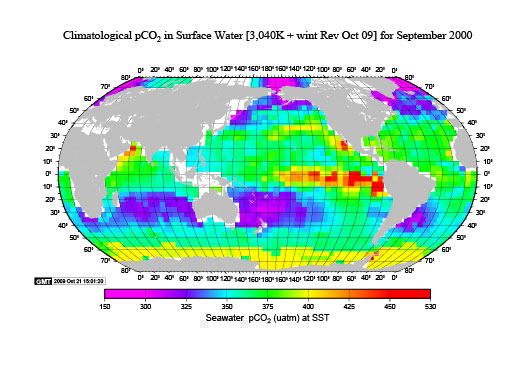
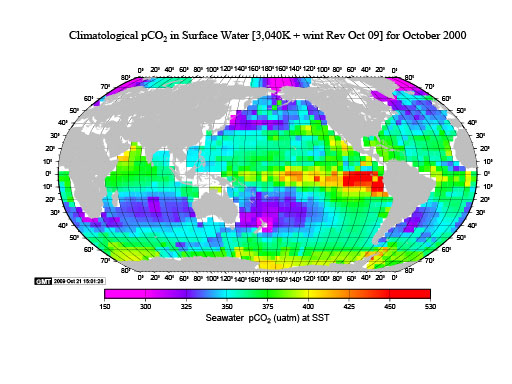
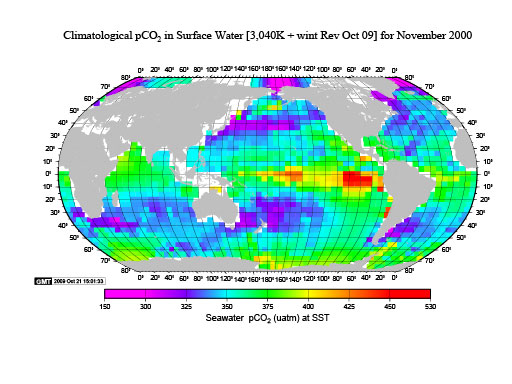
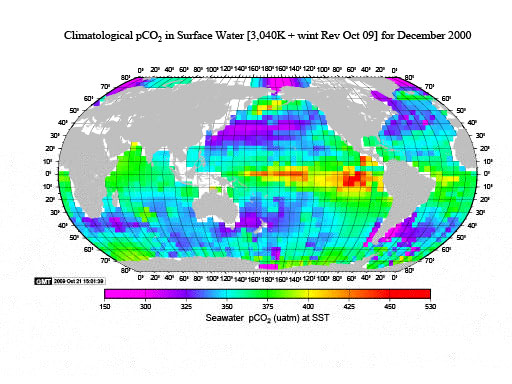
Maps of pCO2 at Sea Surface Temperature
These maps show the mean pCO2 at Sea Surface Temperature for each 4°x5° Box for each of the 12 months. The values are estimated for the year 2000 and were revised in June 2009.
 |
 |
 |
 |
 |
 |
 |
 |
 |
 |
 |
 |
Last modified: 2021-03-17T18:30:21Z