The following protocol for nutrient analysis is taken from the WOCE (World Ocean Circulation Experiment) Methods Manual WHPO 91-1, "A Suggested Protocol for Continuous Flow Automated Analysis of Seawater Nutrients (Phosphate, Nitrate, Nitrite and Silicic Acid) in the WOCE Hydrographic Program and the Joint Global Ocean Flux Study" (Gordon et al. 1993).
This suggested protocol provides a description of procedures which, when implemented by a competent analytical chemist, can provide high quality measurements of the concentrations of the nutrients, silicic acid, phosphate, nitrate plus nitrite, and nitrite in seawater samples. These procedures are not necessarily the only procedures which will meet this claim. Nor are they necessarily the best procedures to use for all oceanographic studies. They have been optimized to provide data to be used in open ocean, deep water,
descriptive and modelling studies. Careful adherence to the protocol and methods outlined can facilitate obtaining data which can meet U.S. WOCE specifications (U.S. WOCE Office, 1989). However, to accomplish this requires a great deal of attention to detail and scrupulous monitoring of the performance of the CFA system. Although it only addresses four of the nutrients being measured in the Joint Global Ocean Flux Studies (JGOFS) program, it can serve as a basis for these analyses in part of that program. The JGOFS program primarily addresses euphotic zone experiments and observations. But it treats deep water column issues and sediment-water situations as well. For near-surface waters the concentration ranges of the nutrients are usually much lower than in most of the WOCE study areas. By adjusting experimental parameters the methods of this Protocol can be made considerably more sensitive for the near-surface work. For JGOFS work in deeper and near-bottom waters and in the Southern Ocean these methods are quite serviceable as they are presented.
2.0 Definition
Several conventions are used for denoting the nutrients discussed here: Silicic acid, phosphate, nitrate plus nitrite, and nitrite. Although some of these conventions are more precise than the abbreviated terms used in this suggested protocol, the authors beg the readers sympathy with the need to be concise. A glossary of terms follows:
ASW = artificial seawater
BPM = bubbles per minute
Brij-35 = a proprietary surfactant, widely sold under this name
CFA = continuous flow analysis (or analyzer)
DIW = deionized water
F/C, f/c = flowcell
I.D. = inside diameter (in reference to pump tubing)
I/F = interference filter
IPH = inches per hour (1 IPH = 7.06 x 10 -4 cm*sec -1 )
LNSW = low-nutrient natural seawater
M = molar (1 gram mole of solute / liter of solution) M or M
Nitrate = dissolved reactive nitrate ion, NO -3
Nitrite = dissolved reactive nitrite ion, NO -2
O.D. = outside diameter (refers to glass or plastic tubing)
OSU=º Oregon State University
OTCR = open tube cadmium reductor
Phosphate = dissolved, reactive, inorganic ortho-phosphate ion, HPO-2 4
psi = pounds in -2 (1 psi = 6.895 x 10 3 Pa)
Silicic acid = dissolved reactive ortho-silicic acid, Si(OH)4 . This undissociated acid is probably the most abundant species of silicic acid and its dissociation products present in seawater. Theoretically it accounts for approximately 80-90% of the silicic acid present in seawater with its first dissociation product constitut-ing most of the remainder. A very small fraction might be present in low molecular weight polymers; however dimers, and probably, trimers are recovered by the method given.
# Silicate, dissolved silica, or sometimes "silica" (Used in this sense, "silica" is not correct chemical nomenclature. Silica denotes solid SiO2 !)
SIO-ODF º Scripps Institution of Oceanography, Oceanographic Data Facility
SLS º sodium lauryl sulfate, C12H25NaO4 S
mM º micromolar (10 -6 moles of solute/liter of solution)
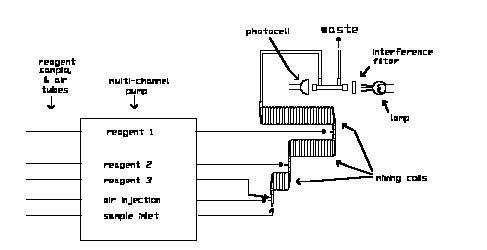
A Continuous Flow Analyzer (CFA) uses a multichannel peristaltic pump to mix samples and chemical reagents in a continuously flowing stream to automate colorimetric analysis. CFAs reduce technician error principally by treating samples and standards exactly alike and by precision in timing and proportioning of reagent addition. Segmenting the sample stream with air bubbles reduces mixing of adjacent samples and enhances mixing of the reagents within the sample stream. The segmented stream passes through a system of glass coils where mixing and time delays are accomplished. The sample-reagent mixture reacts chemically to produce a colored compound whose light absorbance is approximately proportional to the concentration of nutrient in the sample. Finally the absorbance is measured by a flow-through colorimeter located at the end of the flow path. The colorimeter output is an analog voltage proportional to absorbance.
A fundamental difference between manual and CFA procedures is that complete color development is not required with CFA. Since all standards and samples are pumped through the system at the same rate and in constant proportion to the color developing reagents, all samples and standards achieve virtually identical degrees of color development. This saves considerable time and is one reason for the higher speeds attainable with CFA systems. However, this aspect can introduce errors from any factor affecting the kinetics of color development, e.g. laboratory temperature. Laboratory temperature fluctuation historically has caused serious problems with the silicic acid analysis in particular. The modification described in this protocol greatly reduces the effect of ambient laboratory temperature.
In the Oregon State University (OSU) and Scripps Institution of Oceanography -Oceanographic Data Facility (SIO-ODF) programs, the Technicon- AutoAnalyzer - II (AA-II) and Alpkem Rapid Flow Analyzer _ (RFA _ ) systems have been used to determine the seawater concentrations of silicic acid, phosphate, nitrate + nitrite and nitrite since the early 197Os. The principles of these methods are only briefly described here. Operational details for each method are given in Section 8.
The phosphate analysis is a modification of the procedure of Bernhardt and Wilhelms (1967). Molybdic acid is added to the seawater sample to form phosphomolybdic acid which is in turn reduced to phosphomolybdous acid using hydrazine as the reductant. Heating of the sample stream is used to speed the rate of color development.
Nitrate + nitrite and nitrite are analyzed according to the method of Armstrong et al. (1967). At a buffered, alkaline pH the sample nitrate is reduced to nitrite in a column of copperized cadmium. The sample stream with its equivalent nitrite is treated with an acidic sulfanilamide reagent and the nitrite forms nitrous acid which reacts with the sulfanilamide to produce a diazonium ion. N-Naphthylethylene-diamine added to the sample stream then couples with the diazonium ion to produce a red azo dye. With reduction of the nitrate to nitrite, both nitrate and nitrite react and are measured; without reduction, only nitrite reacts. Thus, for the nitrite analysis no reduction is performed and the alkaline buffer is not necessary. Nitrate is computed by difference.
The silicic method is analogous to that described for phosphate. The method used is essentially that of Armstrong et al. (1967), wherein silicomolybdic acid is first formed from the silicic acid in the sample and added molybdic acid; then the silicomolybdic acid is reduced to silicomolybdous acid, or "molybdenum blue," using stannous chloride as the reductant. This method is quite sensitive to laboratory temperature. The method is also nonlinear at high silicate concentrations, necessitating on-line dilution of samples from deep and high latitude waters and/or correcting for the nonlinearity during data processing. The OSU choice has been to dilute high concentration samples on-line by using larger flow of a diluted molybdic acid reagent, while the ODF choice has been to correct for the nonlinearity during data processing. An adaptation of the Armstrong et al. method by Gordon et al. (in preparation) greatly reduces the effect of laboratory temperature and improves linearity. This adaptation is presented here.
4.0 Apparatus
4.1 Continuous Flow Analyzers: This
protocol covers use of either the Technicon AutoAnalyzer -II or the newer
Alpkem _ RFA-300 or Alpkem RFA-2 systems. In this protocol, the abbreviation
"CFA" refers to continuous flow analyzer systems includ-ing both the Technicon
and Alpkem systems. "AA-II" denotes the Technicon Instru-ments Industrial
AutoAnalyzer II systems and "RFA" denotes both the RFA-300 and RFA-2 systems
collectively or separately. All operational and chemical consider-ations
apply equally to both RFAs. The AA-II and RFA systems tested gave compa-rable
results for the same natural seawater samples to which known additions
of nutrients had been made. This remained valid upon comparison of contemporary
deep-water data obtained with the RFA systems with historical data of modern
qual-ity obtained in the same area using the AA-II. The criterion for "comparable
results" is agreement within routinely achieved precision, namely the WOCE
specifications for nutrient precision.
The Alpkem systems have the advantage of speed (ca. a factor of two), lower con-sumption rate of reagents and seawater samples (ca. a factor of four or more) and somewhat lower space requirements for the RFA-II. However the Technicon AA-II hardware is somewhat more reliable and robust and permits longer pathlengths for greater sensitivity for phosphate. Unfortunately, the longer pathlengths and more primitive flowcell designs of the AA-II add to the magnitudes of the corrections for refractive index differences between pure water and seawater.
Both lines of equipment include an automated sampler that introduces the seawater samples into the analytical system at precise intervals. It separates the samples by introducing for short periods of time a "wash" consisting of low nutrient seawater or artificial seawater having low nutrient content. The effect of the wash is to provide a low-concentration marker (generally a negative-going "spike") between samples and between standards. It serves little useful purpose as an actual "wash" of the system.
The next major component is a peristaltic pump that simultaneously pumps samples, reagents and air bubbles through the system. The pump is the analog of the chemist who pipets reagents into samples in manual methods. The analytical "cartridges" are systems of injection fittings, helical mixing coils and heating baths. Figure 8.1 schematically illustrates the general components of a CFA.
For satisfactory results the components must be arranged with several ideas in mind. First, the pathlengths between sampler and pump, pump and analytical "cartridges," etc. must be kept as short as possible. This is especially true of parts of the flow streams that are not segmented by air bubbles, e.g. the lines between the sample "sip-per" and the pump.1 Otherwise excessive mixing between adjacent samples and between samples and wash water results. Second, all components should be arranged in a near horizontal plane. This is especially true of the relationships between the sample sipper tube, the flow stream "waste" outlets and the levels of reagents in the reagent reservoirs. Thus, it is not good practice to locate reagent reservoirs on shelves over the CFA, or drain waste tubes of small diameter into receptacles on the floor. The objective is to avoid large hydraulic pressure heads along the flow stream.
1.The "sipper" is a ca. 1 mm I.D. stainless steel tube that dips into the successive sample containers on the sampler tray under control of the sampler timing circuit.
Large hydraulic heads promote noisy output signals. A third point is to avoid "dead volumes" in the flow channels. These can be introduced by debubblers, voids in butt joints between ends of tubes, and unnecessarily large inside diameter tubing. The solutions are to avoid debubblers if not absolutely required, to cut the ends of pieces of connecting tubing square and make certain they are tightly butted together (and stay that way) and tight in their sleeves, and to use no longer connecting tubing than necessary. Voids at joints between connecting tubing and glass fittings are notorious for disrupting bubble patterns.
Regular bubble patterns are necessary for noise-free output signals. Achieving good bubble patterns primarily depends upon maintaining a clean system. Appropriate wetting agents at proper concentrations are also vitally important in most of the anal-yses. Excessively high temperatures of heating baths can also seriously disrupt bubble patterns.
4.2 Volumetric Laboratory Ware: All volumetric glass- and plastic-ware used must be gravimetrically calibrated. Plastic volumetric flasks must be gravimetrically calibrated at the temperature of use within 2-3K. Temperature effects upon volumes contained by borosilicate glass volumetric ware are well documented and volumes at normally encountered ship and shore laboratory temperatures can easily be computed from any usual calibration temperature (e.g. Kolthoff et al., 1969; Weast, 1985).
A note about the use of glass volumetric ware and contamination of standard solu-tions by dissolution of the glass is in order. In response to reviewers comments to an earlier draft of this manual the OSU group has collected data on dissolution rates of Pyrex _ volumetric flasks. This group of flasks gave initial dissolution rates of 0.03 to 0.045 mM silicic acid per minute into LNSW and virtually no dissolution into DIW.
Note that these data apply to the set of flasks tested and these flasks have had a varied history of prior use in the OSU laboratories. Prior leaching by acid solutions, for example might profoundly influence the dissolution rate. Because of the marked superiority of Pyrex flasks to plastic with respect to thermal expansion and because of the very slow attack by DIW, Pyrex is recommended for preparation of the concentrated "A" and "B" standard solutions (the OSU "ABC" standard solution nomenclature is explained in Section 7). Exposure time to the Pyrex is kept to minimum. The details of use of glass and plastic ware for standard preparation are given in Section 7.
4.2.1 Volumetric flasks. Volumetric flasks
of NIST Class A quality, or the equiva-lent, should be used because their
nominal tolerances are 0.05% or less over the size ranges likely to be
used in this work. Class A flasks are made of borosilicate glass and as
just noted, the standard solutions are transferred to plastic bottles as
quickly as possible after they are made up to volume and well mixed in
order to prevent excessive dissolution of silicic acid from the glass.
High quality plastic (polymethylpentene, PMP, or polypropylene) volumetric
flasks must be gravimetrically calibrated and used only within 2-3K of
the calibration temperature.
4.2.2 Plastic volumetric flasks must be of ISO class 384 tolerance. N.B. All volumetric flasks, including Class A, must be weight calibrated before use! Occasional calibration errors are made by manufacturers. Handbook tables make the computation of volume contained by glass flasks at various temperatures other than the calibration temperatures quite easy (e.g. Weast, 1985). Because of their larger temperature coefficients of cubical expansion and lack of tables constructed for these materials, the plastic volumetric flasks must be gravimetrically calibrated over the temperature range of intended use and used at the temperature of calibration within 2°C. The weights obtained in the calibration weighings must be corrected for the density of water and air buoyancy. The gravimetrically calibrated volumes must be used in com-putting concentrations of standard solutions. The volumes of plastic volumetric flasks calibrated in the OSU laboratory have been stable over several years time. However, it is recommended that each volumetric flask be recali-brated once after an interval of ca. six months and annually after that in order to accumulate good replicate calibration data.
Use of uncalibrated plastic volumetric ware and lack of attention to solution temperature at the time of making up standards can lead to aggregate errors on order of three percent or even more.
Pipets and pipettors. All pipets should have nominal calibration tolerances of 0.1% or better. These too must be gravimetrically calibrated in order to verify and improve upon this nominal tolerance.
Up to this time two commercial pipettors have proven to provide adequate precision for WOCE nutrient work in the experience of the OSU group. The first is the U.S.-made Lab Industries Standard REPIPET _ which dependable provides 0.1% precision. To achieve 0.1% accuracy the REPIPET must be gravimetrically calibrated; because its volume adjustment has been known to shift slightly it must be regularly recalibrated during and after a cruise. Con-siderable skill which can be attained with practice is required to achieve the 0.1% precision. Because REPIPETs employ a glass syringe they contaminate with silicic acid unless certain precautions are taken. A plastic reservoir pre-vents contamination from that source. Flushing the syringe three or four times by dispensing to a waste receptacle immediately before use removes contaminated solution from the syringe.
The second high precision pipettor readily available in the U.S.A. is the Eppendorf Maxipettor. Its specifications claim 0.05 to 0.1% precision and accuracy in delivery volumes ranging from 10 to 1cc, respectively. These specifications apply to use with special, "positive displacement" tips individually calibrated with a matched pipettor. The pipettors and tips must be serially numbered and correct matching maintained during use. Gravimetric calibrations performed by five analysts and technicians of varying skill levels and with four different pipettors and dozens of tips have shown that these specifications are credible. These pipettors should nevertheless be gravimetrically calibrated by each analyst who will use them to verify accuracy for each new pipettor and set of tips and to ensure that each analysts skill with the pipettor is adequate. Because the wetted parts of the Maxipettor are plastic, contamination with silicic acid is not a problem.
There are undoubtedly other commercially available pipettors that have sufficiently high precision and accuracy for this work. However we have not certified any others as of the time of this writing. Other nominations are welcome, particularly when accompanied by qualifying data.
Volumetric, borosilicate glass transfer pipets of the Mohr type are no longer recommended for preparation of reference or calibration standards in the WOCE Hydrographic Program (WHP). There are several reasons for this. Their accuracy and precision, with the most skillful use and gravimetric calibration, do not match those of the Eppendorf Maxipettor. Under marginal conditions of sea state it becomes difficult to maintain the attention to detail in their use required for acceptable accuracy and precision. Being glass and of awkward dimensions they are susceptible to breakage. Breakage at sea makes it impossible to recalibrate them should an error in their calibration be suspected. Maxipettors appear to be remarkably insensitive to operator technique and are quite robust.
Calibration of pipets at sea. This is dependent upon the particular volumetric ware being used. Because their delivery volume settings can slip, REPIPETs must be calibrated once every week to ten days to detect possible changes in delivery volume. At-sea "calibration" is done by dispensing replicate deliver-ies into glass ampules and sealing the ampules with a oxygen-gas torch. Care must be taken not to evaporate any of the water delivered, for instance from a drop deposited in the neck of the ampule. The ampules are returned to the shore lab where the volumes delivered are weighed and the delivery volumes calculated and checked. This is done as quickly as possible after the end of the cruise.
Note that during this step it is not important that glass drawn off from the ampule neck be saved. It may be discarded. However, when the final opening, rinsing and drying of the ampules is performed after obtaining their gross weights considerable care must be taken. One must not only not lose any fragments of glass when cracking off the necks but must keep each paired broken-off neck and parent ampule together. This can be done by assigning each ampule and broken-off neck to their own numbered and tared container such as a borosilicate glass Petri dish. The opened and rinsed (DIW) ampules, necks and their Petri dishes are dried in an oven at 105-110 °C overnight, cooled to room temperature and reweighed.
Other Laboratory Ware. For the remaining laboratory ware the main requirements are convenience, scrupulous cleanliness, and guarding against exposure of either standard solutions or silicic acid reagents to contamination by glass dissolution. Unpublished results of work here at OSU and at the U.S. Geological Survey in Menlo Park, California, indicates that an effective method for cleaning and mainte-nance of standard and sample bottles is by use of acetone (Gordon et al., unpublished results; S.W. Hager, personal communication) or 10% HCl (Gordon et al., unpub-lished results). The acetone procedure consists of rinsing once or twice with DIW to remove most dissolved salts, rinsing once with acetone, rinsing with DIW two or more times and finally storage until next use, "shaken dry" and capped. For the HCl procedure simply rinsing with the HCl followed by thorough rinsing with DIW and storage as for acetone treatment suffices. The HCl procedure avoids the fire and tox-icity hazard of acetone use. Regular cleaning of storage containers reduces variance in the analytical results, i.e., samples degenerate more slowly in well maintained bottles than in dirty ones. Similar cleaning procedures using isopropyl alcohol or DIW instead of acetone or dilute acid did not maintain low variance after storage.
5.0 Reagents
In general all reagents must be of very
high purity. Terms denoting adequate purity in the U.S.A. include "C.P.
(Chemically Pure) Reagent Grade," "Analytical Grade," "Analyzed Reagent
Grade" and others.
N.B. When weighing and packaging "preweighed"
reagents or "preweighs" for work at sea it is imperative that the label
of each preweighed container contain the name of the manufacturer and lot
number from the label of the original container. Further, when making up
the actual reagent solutions, it is imperative that all of the information
contained on the label of the preweighed package be copied into the laboratory
notebook.
The analyst must also note the time and
date of reagent preparation and the time and date when its use is begun.
Such information can be invaluable for tracing sources of problems arising
from "bad batches" of reagents or improperly formulated or weighed reagents.
Special considerations apply for chemical reagents to be used for standard materials because some candidate materials are not available in sufficient or known purity or they may be unstable with time. For example, assays of nitrite salts given by reagent manufacturers are commonly in the range of 95-96%. The assays are often given to 0.1%but the figure is really a minimum guaranteed value and not necessarily precise or accurate; nitrites are unstable salts. Fortunately, nitrite concentrations in the oceans are generally low and the required analytical precision is usually only on order of 2-5% of water column maxima at best. When an assay is given on the reagent bottle one may use that value to adjust the weights taken. Reported nitrite concentrations using this procedure therefore might be biased by ca. one percent, a figure we regard as acceptable for nitrite. If one could assure that the reduction efficiency of the cadmium reductor of the nitrate channel were nearly 100%, the nitrite assay could be checked by passing the nitrite standard through the nitrate channel. Unfortunately, the efficiency of the cadmium reductor is usually checked by comparing the responses of the nitrate channel to nitrite and to nitrate standards, making this difficult. Note that no precision or accuracy specification has been adopted for nitrite concentration in the U.S. WOCE hydrographic program (U.S. WOCE Office, 1989, p.30).
In the WOCE Hydrographic Program the objective
for silicic acid precision is much stricter.
Although the specified objective is only 3% precision and accuracy, several
laboratories routinely achieve short-term,
within-laboratory precision of a few tenths percent
(Weiss et al., 1983). Hence it would seem desirable to achieve accuracy
in preparation of standards to this
level. The goal of the protocols and methods set forth in this
Suggested Protocol is on order of 0.1% for accuracy and precision of standard
preparation. Even though sodium fluosilicate
is a convenient and reproducible material for producing
working standards to calibrate the CFA, it is not available in sufficient
purity to function as a calibration
standard on its own. Individual batches from the same or different
manufacturers differ in equivalent silicic
acid content by as much as 3% or more.
Therefore, although fluorosilicate may
be used as a routine calibration standard, its composition
must be assayed by comparison with standards prepared by fusion of very
pure silicon dioxide.
Sufficient replicate comparisons of pure silicon dioxide (SiO 2 ) with replicate standards prepared from sodium fluorosilicate must be made to assure adequate confidence in the assay. Extremely high purity SiO2 is available from suppliers to the semiconductor industry; more than 99.9% purity is readily available at modest cost. (It must be dried by ignition at high temperature following manufacturers specifications in order to meet this purity criterion.)
A suitable procedure is given by Kolthoff et al. (1969, p. 651). This procedure is followed as far as the dissolution of the fusion cake. At that point the solution is diluted to a precise volume and a suitable aliquot is diluted to a working concentration. This concentration should be similar to that of a fluorosilicate working standard made from the fluorosilicate reagent to be assayed. Finally, the solutions are compared using the method given in this Protocol. Once a bottle of silicofluoride has been so assayed it may be used for years if care is taken to prevent contamination. N.B. At the outset of the assay process the fluorosilicate should be mixed thoroughly using a scrupulously clean metal spatula to assure homogeneity.
5.1 Deionized Water.
Dependable, pure water is an absolute
necessity for the nutrient work. It may be double distilled
water (DDW) or deionized water (DIW). In the case of DDW, the analyst
must be careful to avoid contamination with
silicic acid from dissolution of quartz
or glass stills, connecting tubing or reservoirs. There are several high
quality,
commercially available systems that consistently
deliver high purity DIW having 18.0
Megohm-cm specific resistance or better (American Society for Testing and
Materials, or ASTM, Type I). These systems
generally employ four steps including a prefilter,
a high capacity resin cartridge and two tandem, ultrahigh purity, mixed-bed
cartridges. This water suffices for preparation
of reagents, higher concentration standards and
for measurement of reagent and system blanks.
To be certain of an adequate supply of DIW or DDW at installation time in the ship-board laboratory it may be necessary to obtain reliable DIW or DDW supply from a local laboratory or vendor, perhaps 50 l or more. This supply may have to last through the first few days at sea while purer water from the ships evaporator (distilling system) flushes shore water out of ships storage tanks. In port water supplies are notoriously impure and can rapidly exhaust the very expensive cartridges in a demineralizer system. Furthermore, the high concentrations of silicic acid present in many coastal fresh waters cause some silicic acid to pass through many commercial water purification systems. Often it is best to obtain feed water for the laboratory deionizer system directly from the ships evaporator if possible. The analyst must check the water immediately for possible contamination by phosphate and/or silicic acid. These are common ingredients in formulations for cleaning and eliminating boiler scale in evaporators.
5.2 Low-Nutrient Seawater (LNSW): Final,
working, or calibration standards are best prepared using natural seawater
of low nutrient content as the matrix. Given the complex composition of
seawater, there are manifold possibilities of interferences by exotic constituents.
An inherently dependable way of compensating such errors is to make the
working standards in a matrix as close in composition to the unknown sam-ples
as possible. Fortunately, low nutrient seawater is abundantly available
in open ocean, central gyres in the late spring and summer. Ideally, it
should be collected and filtered through a filter having a pore size of
10 mm or smaller and then be stored in the dark for several months to stabilize.
Filtration and storage are not absolutely nec-essary, but more consistent
day-to-day results will result from use of filtered and aged seawater.
The accuracy and precision of working standards will not suffer markedly
using fresh, unfiltered seawater if the time between preparation and use
of the standards is kept short, less than two or three hours, to avoid
significant change. The nitrate and silicic acid concentrations of the
LNSW should be less than ca. 5 mM
to avoid driving the total concentrations
of these nutrients significantly out of the concentration
range for which the nonlinearity has been measured.
6.0 Sampling
Two factors dictate nutrient sampling
procedures; the range of concentrations of nutrients present
in the oceans, from extremely low to only moderate concentrations, and
the biochemical and chemical reactivity
of the nutrients present in seawater.
The extremely low concentrations present in oligotrophic surface waters of central gyres in spring and summer can be contaminated seriously during sampling and sample storage.Microbial films form on sampler and sample bottle walls in very short times, hours to a few days. Such films can take up or release nutrients significantly.
The nutrients vary widely in biochemical and in vitro reactivity. Nitrite and phosphate are the most labile while silicic acid appears to be the least reactive. Nitrite concentrations in seawater samples and standard solutions often change markedly in a few hours under common storage conditions. Yet silicic acid samples and standards can often be stored at room temperature (in the dark) for days with little detectable change.
At the beginning of every cruise leg and
at approximately weekly intervals or more often if indicated,
the water samplers (usually 10L Niskin samplers in the WHP) must be
inspected for evidence of biological or inorganic
films on the interior walls, valves or end caps.
A powerful flashlight or work light is necessary for this. Watch especially
for iron rust staining on walls near
the points where sampler handles are installed and on the end
caps where coatings on springs may have
worn through allowing the spring to corrode. If present
the rust stains must be removed with 8M, or stronger, HCl. Springs whose
coatings have worn through must be
replaced and any other sources of rust must be eliminated or adequately
protected from corrosion. Check with the hydrographic technicians for
components and assistance. Accumulated microbial
films should be removed using suitable
brushes, scouring agents and detergent solutions. The scouring agents and/or
detergents used must be checked to be certain
they are nutrient-free.
6.1 Nutrient Sample Containers.
These may be made of any of several plastics.
Glass of any kind including "resistance glass" or "borosilicate glass"
is not acceptable. Any glass contaminates the samples
with silicic acid by easily measurable dissolution. 30cc (1oz.) high density
polyethylene or polypropylene small mouth
bottles ("Boston Rounds") serve very well.
These bottles, when filled ca. 2/3 full, contain ample water for either
the AA-II or the RFA. Many laboratories
have shown these bottle materials to be acceptable;they neither add nor
remove nutrients from seawater samples. Before using them for the
first time they are easily cleaned with warm detergent solutions but again,
one must avoid nutrient-containing
detergents. Some workers find 50cc screw-capped,
plastic centrifuge tubes more useful.
The particular plastics in these tubes should be checked
for possible interferences such as adsorption of phosphate from the samples.
The sample bottles or other containers must
be cleaned frequently to prevent nutrient uptake
or release from microorganisms that colonize the inside surfaces. Experiments
were conducted at sea, aimed at reducing variance
in the data that arise from this source
particularly if samples have to be held for a time before analysis, with
or without refrigeration. Cleaning
at least once every four days with acetone or dilute acid
following a procedure such as that in Section 4.3 significantly reduced
variance in replicate samples. The
experiments also showed that rinsing with DIW or isopro-panol is
not effective in stopping the activities of these microorganisms.
After cleaning the bottles may be stored filled with DIW or shaken nearly dry and stored in that condition. They must not be stored filled or partially filled with seawater! At the very least the seawater remaining after analysis should be poured out and the bottles shaken dry.
6.2 Sampling Order, Procedure and Precautions.
In the WOCE Hydrographic Program the nutrient
samples are to be drawn immediately following
the tritium samples and just before the salinity samples for CTD calibration
(Joyce et al., 1991) making them the ninth
set of samples drawn. In general, drawing
the nutrient subsamples immediately after the samplers arrive on deck is
not critically important. It is certainly
less so than for some of the dissolved gases (e.g. dissolved
oxygen, CFCs and other trace gases such as nitrous oxide and carbon
monoxide). The nutrients should be sampled
before the tritium samples if possible. This
can save up to one hour of nutrient decomposition time. In any case, the
analyst should not waste any more time
at this stage than is necessary especially because perhaps
an hour will have already been lost while the other preceding samples have
been drawn. One should try to keep the interval
between arrival on deck and start of analysis
to less than an hour and a half if possible. When no other gas or tracer
samples than dissolved oxygen are to
be taken, the nutrients immediately follow oxygen sampling.
When practical, preliminary start-up of the CFA should be done before
actually beginning the nutrient sampling in
order to keep the delays to a minimum. The
sampling procedure is important. Sample containers must be rinsed three
times with approximately 10-15cc of
sample, shaking with the cap loosely in place after drawing
each rinse. Pour the rinse water into the cap to dissolve and rinse away
any salt crusts remaining from earlier
sampling and trapped in the threads of the cap. Finally,
fill the sample container ca. 2/3 to ¾ full and screw the cap on
firmly.
During sampling care must be taken not
to contaminate the nutrient samples with fingerprints.
Fingerprints contain measurable amounts of phosphate. Thus one should
not handle the end of the sample draw tube, touch the inside of the sample
bottle cap or any place on the sample bottle
neck. Another point to watch while sampling is
not to let the nutrient samples be contaminated with seawater, rainwater
or other spurious material dripping
off the rosette or water samplers.
Immediately upon completion of the nutrient sampling take the samples to the analytical laboratory and begin the analyses as quickly as possible. Again, if possible, have the CFA running with reagents flowing before going to collect the samples. Often the preliminary blank and standard sequences can be programmed into the analyzer during waiting periods while sampling. In a series of observations, phosphate concentrations changed by 0.005 mM/hr for Antarctic waters while sitting in the sampler tubes on the analyzer sampler (Gordon and Dickinson, unpublished data).
6.3 Sample Storage.
Nutrient samples must be analyzed immediately
after sampling if at all possible! The
only exception is if the CFA is not functioning correctly. Refrigeration
of nutrient samples is not effective
for more than an hour or two. Refrigerator temperatures are
not low enough to stop growth of many marine organisms, those which
grow optimally at typical deep-sea temperatures
of 1-4°C. To be sure, growth is slower
at lower temperatures but it is in general not stopped. This problem may
or may not appear with some water samples
from particular regions of the oceans and with
varying degrees of cleanliness of the nutrient sample bottles. There has
not been a great deal of quantitative
data published on this subject (but see Gilmartin, 1967; Grasshoff
et al., 1983; Macdonald et al., 1986; Chapman and Mostert, 1990). However
most analysts agree that whenever possible
natural seawater samples should be analyzed
for nutrients as quickly as possible after collection. Sample storage is
to be avoided in the WOCE hydrographic
program where accuracy and precision are of highest
priority (Group of Technical Experts on Nutrient Analysis, 1988).
As a last resort, if the CFA is not operable and it appears that it can be repaired within less than eight or perhaps up to 12 hours, the samples can be refrigerated in the dark at 4 °C or less. Should this happen, it must be noted in the laboratory note-book and/or on the sample log sheets. In general, the resulting variance and accuracy will suffer.
If longer storage is necessary samples should be frozen as soon after collection and as rapidly as possible. Before freezing ensure that no sample bottles are filled more than ¾ full and all caps are firmly screwed on because loss of brine can cause extreme systematic errors. If a freezer is used, it should be a deep freezer (t <= -20°C). Good air circulation around the bottles in the freezer is important. An open wire rack is preferable to wooden trays. Ensure that the sample bottles remain upright while freezing and while in storage. Again, loss of unfrozen brine will be fatal to good results. Errors on order of 100% can result! Often, when a low temperature freezer is not available, a better freezing method is to use an ice-salt bath and later to transfer the samples to the storage freezer. Another expedient is to use an anti-freeze solution in a bath in the ordinary freezer to improve heat transfer rates during the freezing step. Nutrient samples continuously degrade during frozen storage. Analyze them as soon as possible. Keep a maximum-minimum recording thermometer in the storage freezer to detect otherwise unnoticed, thawing temperatures that might occur before analysis. As a final note, samples should be frozen only as a last resort, when they cannot be analyzed within 8-10 hours of collection.
Important: To thaw frozen samples for analysis use a tepid water bath (ca. 40°C) and thaw the samples in less than 15 minutes; no more at a time than can be accommodated by the CFA, perhaps 5-10 at a time. A running (cold) water bath is also satisfactory if the samples can be thawed within 15 minutes. In either case take care not to contaminate the samples with the water used for thawing; make certain the caps are screwed on firmly and try to keep the bottles upright with the caps above the water line in the bath. Also importantbe certain to mix the samples thoroughly after thawing in order to mix the supernatant, fresher water completely with the con-centrated, underlying brine that was formed by the freezing. Otherwise, errors can exceed 300% depending upon vagaries of geometry of the CFA sampler, ship motion and other conditions.
If silicic acid concentrations exceed ca. 40mM the samples will have to be saved after the first pass through the CFA and re-analyzed after standing for 24 hr. Silicic acid numbers will be biased low for the first pass. Store the samples in the dark at room temperature to allow polymerized silicic acid to depolymerize. Then, mix the samples thoroughly again before analysis.
7.0 Procedures and Standardization:
7.1 Calibration Protocol.
This protocol is designed for calibration of the continuous flow analyzer (CFA) systems to be used for nutrient analyses in WOCE and JGOFS. It assumes that working standard solutions for calibration of the analyzers will be prepared by dissolution at sea of pure, crystalline standard materials, pre-weighed ashore, followed by dilution to appropriate, working concentrations (described in Sections 7.2-7.4). Efforts have been made in the OSU laboratory to prepare stable working calibration standards at oceanic concentrations that can be prepared ashore prior to an expedition, shipped to the expedition ports and stored with integrity for several months. These efforts have not been successful. Therefore this protocol continues the scheme of preweighing and packaging the dry, crystalline standard materials and making the working standard solutions at sea.
The procedure given here consists of first preparing a set of "A" standards using pre-cisely weighed (to ±0.1 mg) primary standard materials (phosphate, nitrate, nitrite) dissolved in DIW and made up to accurately known volumes. The weights taken must be corrected to in vacuo. The nominal weights given here for standard preparation are NOT in vacuo weights. The correction is approximately 0.1%. The buoyancy correction should be calculated for the laboratory conditions of atmospheric pressure, temperature and humidity occurring at a given institution. It will be essentially constant and one value for the correction factor can probably be used at all times. However, this should be checked for each set of laboratory conditions. For all WOCE work and deep-water work in JGOFS, standard concentrations must be calculated for the exact weights taken, not the nominal weights.
Nitrite A standards are made separately but phosphate and nitrate may be made up as a single, mixed A standard. A "B" standard is next prepared by dissolving a pre-weighed silicic acid standard material in DIW, adding an aliquot of mixed or aliquots of single phosphate and nitrate A standard(s) and making the solution up to an accurately known volume. Finally, an aliquot of the B standard together with an aliquot of the nitrite A standard is added and the solution is made up to working, calibration-standard concentrations, or "C" standards, at typical, oceanic concentrations using LNSW. The working standards are thus mixed standards containing all four nutrients. Note that whether or not nitrite is present in the mixed standard appreciable systematic errors in the nitrate results can occur under certain conditions. These conditions are discussed in the section on nitrate analysis.
The proportions of the different nutrients in the standards may need to be adjusted to approximate ca. 80 ± 10% of their maximum concentrations in the ocean basin to be studied. This may be done by adjusting the weights of primary standard materials taken or the volumes of A standards pipetted into the B or working C standards, as appropriate. The proportions to be used must be decided before beginning a cruise leg and not changed during the leg.
To summarize the standard solution nomenclature:
A standard: stock standard solution containing
primary standard nitrate, phosphate,
or nitrite prepared in DIW. It may contain both nitrate and phosphate.
B standard: stock standard solution containing
aliquots of the phosphate and nitrate
A standards plus the primary standard for silicic acid (also prepared in
DIW).
C standard: the calibration standard or
working standard that is actually introduced
into the analyzer for calibration (prepared in low-nutrient seawater).
The timing and frequency of standard preparations,
comparisons and analyzer calibrations given
here represent minimum guidelines. Individual laboratories and analysts
may have more stringent protocols that will
match or improve the accuracy and precision of their work beyond that attainable
with these minimum guidelines. Other protocols are acceptable only insofar
as they result in achieving the WOCE and JGOFS
specifications of precision and accuracy. The protocols given here, if
carefully followed, will assure achievement
of the WOCE and JGOFS specifications.
N.B. It is imperative the analyst keep
a complete and detailed record in the laboratory notebook of all pipet,
pipet tip and volumetric flask identities used for preparation of
each standard. Further, the label information for each preweighed standard
used must also be recorded in the notebook.
Record the date and time of preparation and
date and time placed in use.
7.1.1 Scheduling of preparation of A standards.Prepare
three sets of A standards at the beginning of a cruise or cruise leg.
One will be used for preparation of working,
calibration standards. The others will be used for preparation of reference
standards to be used to check the integrity
of the working A standard. Whenever possible, the first check should
be carried out before the first station of the cruise or leg and certainly
before the end of the first week. The absorbances
of working standards prepared from
the A standards must agree within 0.2, 0.3 and 0.4% for silicic
acid, nitrate and phosphate, respectively.
Nitrite must agree within an absor-bance difference
corresponding to 0.05 mM. If the standards do not agree within
these specifications, a fourth A standard is to be prepared and another
check conducted immediately. Usually the standard
will agree within specifications with
two of the first three and any of them may be used to prepare the
working standards. If not, a fifth must be
prepared, checked and the preparations repeated
until satisfactory results are obtained. If this requires more than
three preparations something is likely to be seriously wrong with homogeneity
of the standard reagent material, the weighings
or the volumetric work. Any wildly
discordant A standard preparations may be discarded after complete
and appropriate notes have been entered in the field notebook. Thus,
a sufficient number of dark, plastic storage bottles must be provided to
save up to four A standards. Retain
all concordant A standard preparations throughout a cruise leg, or
until used up. Prepare a fresh A standard
at least once a month and immediately check
against the previously prepared standards. If possible, the working
A standards should be compared with an A check
standard once per week, the comparison
data processed and examined that day and results of the
comparison noted in the seagoing lab notebook.
7.1.2 Scheduling of preparation of B standards:
Prepare B standards at least once per week. This frequency must be monitored
for the particular shipboard laboratory conditions
by following this scheduling protocol. More frequent checking
may be necessary under some conditions. Lack of agreement within
the specifications noted earlier is an indication that more frequent comparisons
are required. Note that each B standard preparation requires a new, preweighed
silicic acid standard. Provision must be made for a sufficient number
of B standard preparations to meet the worst-case number of preparations
for the duration of the cruise.
7.1.3 Scheduling of preparation of C standards: These are, in general, stable for no longer than four to six hours. They must be prepared just before each station unless the stations are separated by no more than three hours. Lack of agree-ment between results from deep water samples from adjacent stations may indicate storage of working, calibration standards for too long.
7.1.4 Frequency of calibration of the nutrient
analyzer.
The drifts of the nutrient analyzer sensitivities
for all the methods, colorimeters and
laboratory conditions checked at OSU appear almost always to be
monotonic and approximately linear with time.
This seems valid for periods of about
one to one and a half hours, approximately the time required to analyze
one stations set of samples. It also assumes
use of the low temperature drift modification
of the silicic acid method described here (Gordon et al., in preparation).
Therefore the protocol presented here consists of running a complete set of reagent blank (DIW) samples, working standard matrix (MAT) and upscale concentration (STD) calibration standards only at the beginning and end of each stations set of samples. If the time lapse between standard sets exceeds one and a half hours, sample degradation can become a problem. Possible remedies include dividing the samples into batches with standards and blanks at beginning and end of each, or the station sample sequence can be interrupted to allow a mid- batch standard and blank set. If the OSU nutrient data processing software is being used, it must be modified to correctly process the data. At present it cannot handle mid-batch standards and blanks.
7.1.5 Linearity ("Beers Law") checks.
Although all of the analytical methods described in this Suggested Protocol are sufficiently linear for the WHP (when corrected as necessary), linearity must be checked at the beginning of the cruise or leg, before any samples are analyzed. The checks must be repeated once a week thereafter and again at the very end of the station work, just after or together with the last stations samples. There are several reasons for this. One is that performing a linearity check provides a good test of system performance. It helps assure that all of analytical parameters are correctly set up. The data from the first linearity test can be used to evaluate the "carryover correction" for each channel, an excellent quality control check. If the data originating group chooses this approach the linearity data are used to correct for nonlinearity. This approach wont be discussed here. Perhaps most importantly, if an operating parameter has inadvertently been changed, thereby making a method excessively nonlinear, the existence of the nonlinearity measurements permits post-cruise correction. All of the methods presented here are linear within experimental error on averaging of several linearity checks. This should be true with a mid-scale offset from a straight line of less than 0.2%. If not, something is wrong and troubleshooting must be started before any samples (or any more samples) are analyzed. For the previous CFA methods for silicic acid from ca. 1973 to the present there was a mid-scale non-linearity of ca. 0.4 to 0.7%. This is a sensitive function of the extent of dilution of the sample to acceptable, maximal concentrations. The new silicic acid method described in this Suggested Protocol, optimized to reduce lab temperature sensitivity, also meets this nonlinearity specification.
7.2 Materials for Preparation of Calibration
Standards, General Considerations.
We now give a detailed set of instructions
for preparation of the working, or calibration standards.
The reference A standards to be used for checking the working A
standards are prepared according to the same
instructions and using the same high-accuracy volumetric
techniques as for the calibration standards. Again, the working,
or calibration, standards are used for calibrating
the CFA; the reference A standards are
used for checking the integrity of the calibration standards.
7.2.1 The primary standard materials:
These must be chemically pure, reagent grade or primary standard grade
chemicals, crushed and dried at 105°C for ³ 2 hours and stored
in a desiccator over BaO or MgSO 4 (P 2 O 5 also may be used but with care
to avoid contamination). NB. The chemicals are finely crushed using a carefully
cleaned mortar and pestle; they must not be ground! There is a difference.1
Again, weights must be corrected to in vacuo in order to achieve 0.1% accuracy
which is desirable given the reproducibil-ity attainable with CFA. The
weights given below are nominal. If, for effi-ciency, exact weights are
not taken, careful track must be kept of the exact weights placed in each
"preweighed" container, air buoyancy corrections made, and actual concentrations
used in subsequent computations of concen-trations.
7.2.2 Deionized water (DIW): This is prepared by passing fresh water through two or more research grade, mixed-bed, ion exchange columns. See Section 5.1 for more details on commercially available systems capable of producing acceptable deionized water.
7.2.3 Artificial seawater (ASW).
ASW of salinity ca. 34.7 is prepared by
dissolving 128.5 g sodium chloride (NaCl);
28.5 g magnesium sulfate heptahydrate (MgSO4 .7H2O);
and 0.672 g sodium bicarbonate (NaHCO3
) in four liters of DIW. These reagents must be high
quality reagent grade, to avoid excessive nutrient or trace metal contamination.
ASW is used for wash solution between seawater
samples and in an emergency for making
up the C standards (and, in that case, it also substitutes for
the LNSW).
Some laboratories have been more or less successful in making "zero nutrient" artificial seawater for measuring reagent blanks. Usually the constituent salts are too contaminated with nutrients to make this feasible, particularly with respect to phosphate and silicic acid. With the advent of commercially ultra-high purity materials this might now be possible. If so it would be nice to have an artificial seawater of essentially zero nutrient concentration with which to measure reagent blanks without having to worry about refraction errors.
There appear to be two drawbacks to this approach but it should be pursued. First, it is likely to be quite expensive to make ASW in the necessary quantities. Second, it is possible that interfering substances in natural seawater but not present in the usual recipes for ASW might be quantitatively significant.This places a burden of responsibility upon a laboratory using that approach to guard carefully against this possibility.
7.2.4 Low-nutrient seawater (LNSW): Natural seawater containing low concentra-tions of nutrients should be filtered upon collection and stored in the dark for three or four months to stabilize (see Section 5.2). This water is used for preparation of the C standards. It need not contain "zero" nutrient concentra-tions because it is not used for reagent blank measurements. Also, it is usu-ally too precious to be used for "baseline checks." OSU requirements are usually ca. 100L for a typical one-month WOCE-type expedition leg.
7.2.5 Volumetric glassware: For reagent preparation it is not necessary to calibrate the volumetric ware used. For standard preparation it must be gravimetrically calibrated! (See Section 4.2)
7.3 Preparation of A Standards.
7.3.1 Phosphate and nitrate A standards: 2,500 mM HPO4-2 and 37,500 mM NO3 - . Quantitatively transfer 0.3402 g potassium di-hydrogen phosphate (KH2 PO4 ) and 3.7912 g potassium nitrate (KNO3 ) to a calibrated 1000 ml volumetric flask and dissolve in DIW, bring exactly to the mark with DIW. If using a gravimetrically calibrated plastic volumetric flask, the temperature of the DIW must be within 2°C of its calibration temperature. This A standard may be made up as two individual phosphate and nitrate solutions with subsequent aliquots in Table 8.1 adjusted accordingly.
7.3.2 Nitrite A standard: 2,000 mMNO2 - . In a 1000 ml volumetric flask dissolve 0.1380 g sodium nitrite (NaNO2 ) in DIW and dilute exactly to the mark with DIW. Pure NaNO2 is difficult to obtain; one should check the manufacturers assay (e.g. Kolthoff et al., 1969, p. 821). The typical purities of 97-98% are usually adequate for oceanographic purposes (see Section 5.0).
7.4 B Standard: 2500 mM in silicic acid, 50 mM in phosphate, 750 mM in nitrate.
7.4.1 Quantitatively transfer 0.4701 g sodium silicofluoride (Na2SiF6 ) to a 1000 ml polypropylene or PMP Erlenmeyer flask containing ca. 800 ml of DIW, cover with plastic film and dissolve on an electric reciprocating shaker at moderate speed. Alternatively, the solution can be stirred with a shaft stirrer using a plastic stirrer. Complete dissolution usually requires 2-24 hours. Gen-tle warming can be used to speed dissolution of the fluorosilicate. Again, note that sodium fluorosilicate cannot easily be obtained in purities greater than 99%. Hence it must be assayed against pure SiO2 (available in ultra-high purity grades, see Section 5.0).
7.4.2 Inspect the solution for undissolved material and record the observation in the notebook. Quantitatively transfer the solution to a 1000 ml Pyrex _ volu-metric flask. Add: 20ml HPO 4 -2 + NO 3 - mixed A standard or 20 ml each of the separate HPO 4 -2 NO 3 - A standards if so formulated. The actual 20 ml vol-umes dispensed must be known to ±0.02 ml.
7.4.3 Dilute to the 1000 ml mark exactly with DIW. Mix thoroughly.
7.4.4 Store in a polyethylene bottle previously well-rinsed with acetone, DIW, then with three 15-20 ml portions of this B standard. Do not forget to rinse the bottle cap also.
Table 8.1 Concentrations of nutrients in the B standard
NO3 - 750 mM
NO2- 0 mM
Si(OH)4
2,500 mM
7.5 Working Standards: Of various nominal
concentrations.
Nominal concentrations, given in Table
8.2, are obtained by diluting the given volumes of
B standard and Secondary Matrix Solution to 500 ml with LNSW. These
proportions between nutrient concentrations
have been found convenient for Pacific and
Antarctic work. As noted earlier, they may be, and should be, adjusted
for other ocean basins. This may be
done by adjusting weights of solid primary standard materials
and/or the volumes of aliquots taken at suitable points in the preparations.
All working standard concentrations are nominal
and must be corrected according to the
gravimetrically calibrated volumes contained by all the volumetric flasks
and deliveries of all the pipets employed,
corrected to the temperatures at which the flasks
and pipets are used. For the best work, the calibrations must be checked
before and after each cruise and no
less often than every six months.
Possible changes in nutrient concentrations of the B standard over time must be monitored by comparing freshly prepared B standard with B standard that has been stored one day or more. In general, HPO 4 -2 , NO3 - and Si(OH)4 concentrations are stable for several days in the B standard (if NO2- and/or NH3 were also present in the B standard formulation their concentrations commonly would change appreciably after only 1 or 2 days). However, this is only a guideline. The B standards must be monitored and the guideline confirmed or adjusted for each expedition because the stability of the B standard may change as a function of the particular conditions prevailing during any given time.
8.0 Analytical Methods
This section presents the details of each
of the analytical methods for use with either the AA-
II or RFA systems. The chemistry of the methods is the same for each. Of
course the pump tube volumes and details
of plumbing will differ. Flow schematics, reagent formulations
and special notes where appropriate are given for both systems.
The reader will observe that analytical wavelengths for the analyses in general differ somewhat for the AA-II and RFA methods. This is mainly historical, having to do with availability of interference filters at optimum wavelengths in the early years. In some cases it was the result of the wavelengths having been specified by previous authors or by the instrument vendors. The wavelengths given here are all satisfactory if not always maximally optimum. To assure optimal wavelength selection, it is good analytical practice to measure the absorption spectrum of the colored species for each analysis as produced by the particular method used. This is done by collecting the effluent from the flowcell, preferably directly into a microflowcell, and measuring the spectrum as quickly as possible. Modern, linear diode array spectrophotometers help immensely in this regard. It is also good technique to regularly measure the band pass spectrum of each and every interference filter to be used in all of the analyses; this includes measurement of the spare filters as well. The interlayer metal films of interference filters are subject to corrosion with resultant loss of transmission and widening of bandwidth.
Table 8.2: calibration standard recipes and concentrations
|
|
|
|
|
|
|
|
|
|
|
|
|
|
|
|
|
|
|
|
|
|
|
|
|
|
|
|
|
|
|
|
|
|
|
|
|
|
|
|
|
|
|
|
|
|
|
|
|
|
|
|
|
|
|
|
|
|
|
|
|
|
|
|
|
|
|
|
|
|
|
|
|
|
|
|
|
|
|
|
NB. When preparing reagents is imperative that the analyst carefully record all of the label information for all preweighed reagents in the laboratory notebook. The analyst must also record the date and time of preparation, her or his initials as preparer and when each new batch of reagent is placed in use. At the beginning of the expedition leg the analyst should enter his or her full name and initials to be used to annotate each reagent preparation and the time of coming on watch.
8.1 Phosphate:
The phosphate method is a modification of the procedure of Bernhardt and Wilhelms (1967) employing hydrazine as the reductant. This method provides ca. 15% increased sensitivity over the ascorbic acid method often used and at the same time seems to reduce coating of the flowcell window. Because of reduced flowcell coating it also exhibits less drift than does the stannous chloride method previously reported (Hager et al., 1968). Slow coating of the flowcell windows does occur with hydrazine over a period of a few weeks. The coating can be removed by treatment with 5.4 M (30%) sulfuric acid approximately once a week.
The manifolds for the analysis are shown in Figure 8.2. For the AA-II a 5cm flowcell and Technicon _ wide range S-1 phototubes (also designated as CE-25V) are used.Historically, 830 nm interference filters were used but because the absorbance maximum is rather broad, 820 nm is equally acceptable. 820 nm is routinely used with the RFA. This phosphate method characteristically exhibits a linear response up to 5.0 mM HPO42- with a worst-case deviation from a linear regression through the Beers-Law check data of less than 0.1% of full scale. This was the highest concentration tested. At the wavelengths indicated the analytical sensitivity is 0.071 AU/mM phosphate in the seawater sample stream. Maximum absorbance for the highest open ocean concentrations is ca. 0.25 AU.
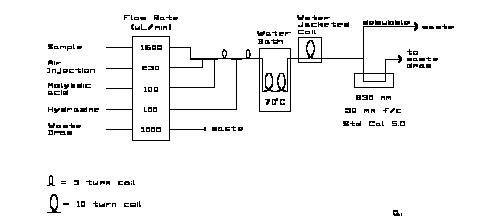
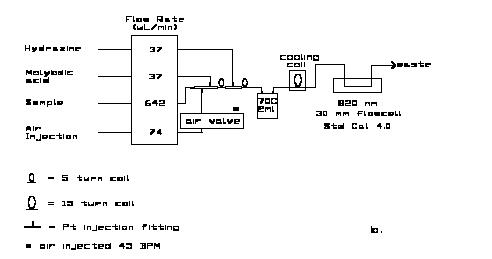
Note that the SIO-ODF analytical group uses an insulated air bath for the accelerated color development instead of a water bath. Also, in that modification, there is no water jacketed cooling coil between the heating bath and the colorimeter. Drafty conditions in some shorebased and shipboard labs might cause the sample tream entering the colorimeter to fluctuate in temperature and cause noisy colorimeter output. This needs to be checked for individual installations and conditions.
At this writing, the AA-II appears to give more dependable performance with the phosphate analysis. The RFA tends to be somewhat noisier and exhibits drift more frequently. When, as usual, it is functioning correctly it matches the AA-II in performance.
8.1.1 Reagent Preparation:
8.1.1.1 Molybdic acid reagent, 0.186 M in 6.3 M sulfuric acid.
8.1.1.1.1 Ammonium molybdate, 0.088 M;
109 g (NH 4) 6
Mo7 O24 * 4H2O, diluted to 1000 ml with
DIW.
NB. Seven moles Mo/mole ammonium molybdate
enters the calculation of the concentration
of the final reagent.)
8.1.1.1.2 Sulfuric acid, 8.8 M; carefully add 1280 ml concentrated H2SO4 to 1620 ml DIW. Allow to cool between partial additions. Cool to room temperature.
8.1.1.1.3 Molybdic acid. Mix above and allow to cool. If the reagent has a bluish tinge or a precipitate develops, discard it and prepare a new solution. Store in a dark polyethylene bottle. This is usually stable for three to four months. Requirement: AA-II, 150 ml/24 hours; RFA, 54 ml/24 hours.
8.1.1.2 Hydrazine sulfate, 0.062 M (1% w/v). 2.5 g dihydrazine sulfate, (NH2)2SO4 , are dissolved and diluted to 250 ml with DIW. This reagent is usually consumed before any sign of instability is noticed; no particular storage requirements. Requirement: AA-II, 150 ml/24 hours; RFA 54 ml/24 hours. 0.5ml Aerosol-22 per 250ml may be added to this reagent.
8.1.1.3 Wash Water: Artificial seawater should be used to wash between samples. This will greatly reduce noise in the recorder trace caused by refractive effects of switching between seawater and distilled water. Natural seawater having a very low concentration of nutrients also can be used if a plentiful and cheap source is available.
8.1.1.4 Wetting agents: The methods presented here do not use wetting agents, relying instead upon keeping the flow system scrupulously clean. Some workers have reported problems with interferences and erratic baselines when using wetting agents with the phosphate analysis. Experience at OSU is consistent with these observations.
8.2 Nitrate:
The nitrate + nitrite analysis uses the
basic method of Armstrong et al. (1967) with modifications
to improve the precision and ease of operation. The original method is
unacceptably non-linear at concentrations
above ca. 15 mM.
To achieve a more linear response in
the AA-II system we dilute the sample. One scheme requires one sample
tube (0.23 ml/min) and a DIW dilution tube
(1.20 ml/min), an arrangement which provides
linearity up to 40.0 mM
and adequate sensitivity for deep water nitrate samples. Alternatively
the buffer solution may be diluted and its pump tube size increased to
provide the necessary dilution while keeping the sample tube size constant.
A similar procedure may be employed with the
RFA. The methods shown here include
the latter modification. Conversely, at low concentrations, higher sensitivity
can be had by concentrating the buffer solutions
and using higher sample to buffer flow
rate ratios.
The manifolds for the analysis are shown in Figure 8.3. For the AA-II a 15 mm flow-cell, selenium photocells and 520 nm interference filters are used in the colorimeter. For the RFA the standard Alpkem phototubes and 540 nm filters are used. At the wavelengths shown the analytical sensitivity is ca. 0.0048 AU/mM nitrate (and/or nitrite) in the sample stream. Maximum absorbance for the highest open ocean concentrations is ca. 0.25 AU.
Note that the two small circles at the ends of the "U"-shaped cadmium column in the AA-II diagram denote two, three-way valves used to switch the column in and out of the flow system without having to shut off the pump. One four-way valve can also be used. Care must be used in selecting and using a suitable valve to minimize bubble breakup or introduction of unwanted dead volume into the sample stream. Care must be exercised in turning an otherwise satisfactory valve to the proper position to avoid bubble breakup. In some installations only one three-way valve is used, the down-stream one being replaced by a tee. This diverts the flow around the column but does not completely isolate it from the sample stream. The end left open can allow slow diffusion of unbuffered rinse water into the column, as the pressure in the system oscillates during the channel shutdown and start-up periods. With attention paid to this possibility, the system can be operated without undesirable column degradation.
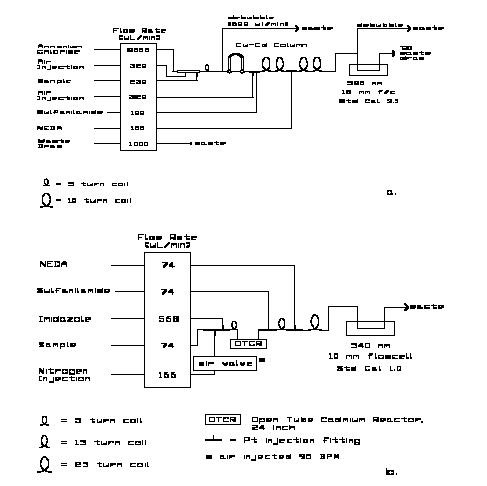
"Copperized" cadmium reduces nitrate to nitrite in both the AA-II and RFA methods. (The methods actually measure this nitrite.) The AA-II uses a packed column, the RFA an open tube cadmium reductor (OTCR). The latter has the advantage of being more convenient to use, lower toxicity hazard in handling and no requirement for debubbling the flow stream prior to its entry into the reductor. It is purchased completely fabricated for conditioning and insertion into the system. Its main disadvantage is its high cost. From time to time vendors have supplied defective columns which required (no-cost) replacement at some inconvenience to the user. Directions for preparing packed columns are given in section 8.2.2. For instructions on activating and maintaining the OTCR, see the Alpkem manual for the RFA-300 or RFA-II. We find their instructions complete and reliable. Although the OSU RFA method employs the OTCR, either reductor type can be used with good results. N.B. Take very seriously the Alpkem instructions for storage of the OTCR between measurement sessions. OTCRs can be irreparably destroyed by improper storage. If, for analytical efficiency, as is recommended in this Protocol, the nitrate and nitrite channels are calibrated using mixed nitrate and nitrite working standards, reductor efficiency must be carefully monitored. This is done by comparing the response of the nitrate channel alternately to nitrate and nitrite standards at nearly full-scale nitrate concentrations. As an example one may place ten each, alternate 30 mM standard nitrate and nitrite solutions in the sampler. Note that nitrite salts are commonly less than 100% pure while nitrate reagent grade salts are typically 99.9% pure or better. This means that if the reductor were 100% efficient in reducing nitrate and also did not further reduce any nitrite it would be possible to observe 100% or greater efficiencies, that is, higher response to nitrate than to nitrite solutions of the same concentration. This rarely happens. Reductors usually gradually degrade yielding reduction efficiencies that can drop below 90%, 80% or less. Although the final degradation of the column can be rapid, the early stages of gradual degradation can be insidious. Garside (1993) has shown that for low column efficiencies (85%) and some combinations of nitrate and nitrite standard and sample concentration ranges serious systematic errors in observed nitrate concentration of more than 1 mM (up to 3% of deep water values) can occur.
To prevent this from happening, the analyst must regularly measure the reductor efficiency and monitor the magnitude of the nitrate sensitivity factor. The reductor efficiency should be checked at least once a week and the sensitivity factor should be checked as quickly as possible at or even before the end of every set of analyses. For the WOCE program the reductor should be reactivated if the efficiency drops below 95% and replaced if reactivation cannot bring the efficiency above 95%. To minimize the adverse impact of low reductor efficiency, the nitrite calibration standard concentration should be kept as low as possible for the oceanic region of study. For open ocean studies, away from intense upwelling systems (e.g. northern Indian Ocean bays, Peruvian upwelling system) or open ocean locations like the Costa Rica Dome where high nitrite concentrations can be expected, nitrite calibration standards should be limited to at most ca. 1.0 mM.
8.2.1 Nitrate Reagents:
8.2.1.1 Ammonium Chloride buffer/complexing agent, NH4Cl, 0.71 M (3.8% w/v) for the AA-II method. Dissolve 38 g NH4Cl and 1 ml BRIJ-35 per liter in DIW. Its convenient to make this in 4 L batches because of the high consumption rates. Requirement: AA-II, 1400 ml/24 hours. This is the historical Technicon buffer but the RFA imidazole buffer which follows may also be used, with excellent results.
8.2.1.2 Imidazole buffer/complexing agent, 0.05 M, containing copper (3 mM), for the RFA method. Dissolve 6.8 g imidazole, C3H4N2 , in ca. 1500 ml DIW; add 30 ml ammonium chloride- copper sulfate stock solution (described below) and 2ml BRIJ-35; make up to 2000 ml with DIW. Adjust the pH to 7.8-7.85 with concentrated HCl (ca. 2 ml). This reagent is usually consumed before showing any signs of instability; no particular storage requirement. Requirement: RFA, 820 ml/24 hours.
8.2.1.3 Sulfanilamide, 0.06 M (1% w/v) in 1.2 M HCl. Dissolve 10g sulfanilamide, 4-NH2C6H4SO3H, in 1 L of 1.2 M (10%) HCl. Stable at room temperature. Requirement: AA-II, 150 ml/24 hours; RFA, 106 ml/24 hours.
8.2.1.4 N-1-Napthylethylene-diamine dihydrochloride, NEDA, 0.004 M.Dissolve 1 g NEDA, C10H7NHCH2 CH2NH2 * 2HCl, in 1 L of DIW. Refrigerate in an airtight, dark bottle; discard if colored. Requirement: AA-II, 150 ml/24 hours; RFA, 106 ml/24 hours.
8.2.1.5 Ammonium chloride-copper sulfate stock solution, 4.7 M NH4Cl 0.2 mM CuSO4 . Dissolve 250 g ammonium chloride, NH 4 Cl, in 1 L DIW, add 2.5 ml copper sulfate stock solution. Requirement: One liter lasts for more than one month-long cruise.
8.2.1.6 Copper sulfate stock solution, 0.08 M. Dissolve 20 g cupric sulfate pentahydrate, CuSO4 * 5H2O, in 1 L DIW. Stable at room temperature. Requirement: One liter lasts for much more than a month-long cruise.
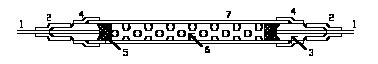
8.2.2 Cadmium Column Preparation and Maintenance:
For the AA-II. Figure 8.4 shows a Cd-Cu
packed column. (Packed columns are
used in all AA-II work and may also be used for the RFA. More on this
later.) Note that SIO-ODF uses unwaxed dental
floss rather than glass wool for item
5.
8.2.3 Prepare the column as follows:
8.2.3.1 Sieve 250 g of E. Merck 1 granulated cadmium (Product No. 2001)eeping the 20-50 mesh size fraction.
8.2.3.2 Wash sieved granules several times with isopropyl alcohol, DIW and 1.2 M HCl; rinse well with DIW.
8.2.3.3 Wash granules with 75-100 ml of 2% w/v copper sulfate stock solution. Repeat, allowing the blue color of the solution to disappear before decanting and adding fresh solution. After treating the granules with about 500 ml of 2% copper sulfate solution they should appear bright again. Wash the "copperized" granules with DIW several times to remove all colloidal Cu. From this point on, it is very important to avoid any further exposure of the cadmium granules to the air. They must be kept covered with DIW or buffer/ complexing agent at all times. For this reason, some workers prefer to pack the column before copperizing and to then copperize the packed column either using syringes for the copperizing, washing and conditioning solutions or doing it online using the system pump (e.g. Mostert, 1988). However, great care must be taken to prevent passing fine copper particles into the flowcell! Therefore one must disconnect the outlet of the column from the rest of the system and pass its effluent to waste during online copperizing and washing steps. Failure to observe this precaution may cause noisy traces during analysis because of copper particles trapped in the flowcell.
8.2.3.4 Transfer the granules in suspension to the column (see Wood et al., 1967). To prevent trapping of air bubbles, the column should be filled with water and the lower connecting tubing sealed off. The full column should be tightly packed with the granules, tapping while filling to assure this. Carefully add the other end fitting without adding air bubbles. In this form, the column can be stored air 1. Can be purchased through E. M. Laboratories, 500 Exec. Blvd., Elmsford, N. Y. 10523. free for several weeks. The column body may be either glass or PVC tubing. PVC is less fragile. Segmenting the flow stream with nitrogen instead of air in the AA-II method, as is done with the RFA, will give longer column life.
8.2.3.5 The column is conditioned on stream. Before introducing the column to the sample stream, start the buffer through and allow sufficient time for it to flush the system beyond the column inlet. Momentarily stop the pump. Add the column to the sample stream keeping it free of air bubbles. Restart the pump. Stopping the pump is not necessary if a single three-way or a four-way valve is used to isolate the column. The column is then conditioned by running 30 ml of 2.5% w/v Na 2 EDTA and 10 ml of 60-100 mM nitrate standard through it. (SIO-ODF finds the EDTA conditioning step unnecessary.) Be sure to remove and flush any sulfanilamide reagent from the system before this conditioning. The acidic sulfanilamide reagent can precipitate the EDTA and clog the flowcell or a transmission line. Columns prepared and conditioned in this way remain effective for hundreds to thousands of samples.
For the RFA. Either a packed column or an open column tubular reductor (OCTR) may be used. The OTCR has the advantage that the flow stream does not require debubbling before passage through the reductor. The presence of a debubbler in the system increases carryover as noted earlier in this Protocol. The useful lifetime of an OTCR seems to be comparable to that of a packed column reductor. Reduction efficiency is also comparable. However, some workers have chosen to use packed columns with the RFA and have accepted the need for debubbling, claiming better performance or column life. If a packed column reductor is used for the RFA its inside diameter should be reduced by a factor of ca. 2 from the AA-II, and debubbling will be necessary. It may also be necessary to use a finer size fraction for the cadmium granules. The OSU group has no experience using packed column reductors with the RFA systems.
Preparation of the OTCR is similar to the preparation of the packed column reductor with obvious differences such as not having to transfer cadmium granules to the reductor. The OTCR is particularly convenient and easy to clean, copperize and condition. Most operations are easily performed using 5 or 10 ml plastic syringes to hold the successive reagents. The detailed instructions for preparing and maintaining the OTCR that come with the RFA systems are clearly written and should be followed carefully to assure proper operation and long life of the OTCR. Imidazole is the usual buffer/Cd complexing agent for the OTCR and may be used quite successfully with packed columns as well.
8.2.4 Factors Affecting the Success of the Methods:
8.2.4.1 The sample/dilution mixture must be thoroughly mixed prior to entering the debubbler in the AA-II method.
8.2.4.2 Bubbles must be rigorously excluded from the reducing column in the AA-II method.
8.2.4.3 The column should be well packed but not so densely that flow is impeded. Good packing minimizes dead space and greatly improves resolution.
8.2.4.4 Colloidal copper formed during the "copperizing" step causes serious problems and must be removed from the cadmium by thorough washing.
8.2.4.5 Whenever transmitting an unsegmented stream (e.g. the output tubes from packed Cd-Cu columns and debubblers) use small bore (1 mm I.D.) tubing. This decreases transmission time and minimizes carryover of samples.
8.2.4.6 Both packed columns and OTCRs should be kept filled with buffered sample or buffered DIW stream at all times; never with unbuffered DIW or sample. Before introducing the column into the flow stream, make certain that buffer has reached the reductor inlet point. When shutting down the system be sure to isolate the reductor before moving the buffer tube from the buffer reservoir to DIW. A microbore, four-way valve at this point in the system works very well for this as does a three-way valve (cf. section 8.2).
8.2.4.7 Linearity checks are important in the nitrate method..3 Nitrite:Nitrite analysis is performed on a separate channel, omitting the cadmium reductor and the buffer. The volume flow of the buffer is compensated by using a correspondingly larger sample pump tube; this also increases sensitivity. Nitrate concentrations never become high enough in the open oceans for the system response to become unacceptably nonlinear. The colorimeter sensitivity may also be increased by resetting the "Standard Cal" potentiometer and or using a longer flow cell. The resultant flow system is shown in Figure 8.5. All reagents required are described in Section 8.2.1. At the wavelengths indicated the analytical sensitivity is 0.056AU/mM nitrite in the sample stream. Maximum absorbance for the highest open ocean concentrations is 0.25 AU.
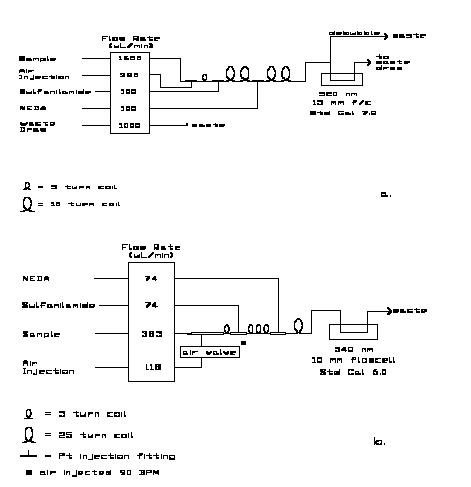
8.4 Silicic Acid:
The method is based on that of Armstrong
et al. (1967) as adapted by Atlas et al. (1971).
The modifications presented here reduce its sensitivity to laboratory temperature
(Gordon et al., in preparation). The rationale
is explained in a later paragraph.
The Armstrong et al. silicic acid method is excessively nonlinear at deep-water concentrations. The modified method shown also reduces the nonlinearity to an acceptable degree over the oceanic concentration range of 0-200 mM silicic acid. However, considerable nonlinearity can also be corrected in the data processing stage as is done by the SIO-ODF. At the wavelengths indicated the sensitivity is ca. 0.006 AU/ mM silicic acid in the sample stream. Maximum absorbance for the highest, open ocean concentrations is ca. 1.0 AU.
Figure 8.6 shows our flow diagrams and operational parameters for the silicic acid analysis. The colorimeter for the AA-II uses a 15 mm flowcell pathlength, 660 or 820 nm interference filters and Technicon S-10 phototubes. The interference filters for the RFA are either 815, 820 or 660 nm and the flowcell pathlength is 10 mm. The 660 nm choice for the AA-II reduces the degree of nonlinearity. Although sensitivity is less at this wavelength, the method is sufficiently sensitive for deep, "blue-water" work. The absorbance maximum lies at ca. 813 nm and at that wavelength somewhat better sensitivity and, to some extent, linearity result. Unfortunately filters close to this wavelength have not been available until recently. They are now available at 815 nm for the RFA but not for the AA-II. Results at this wavelength have been favorable so far. Some methods call for work at 880 nm. Spectra for blanks taken at OSU have shown considerable blank absorbance and this wavelength also lies well down the side of the absorbance maximum, not an ideal analytical condition.
The marked temperature sensitivity of the
Armstrong et al. method is caused by the very
short time allowed for production of silicomolybdic acid by reaction of
the molybdic acid and the silicic acid
in the sample. The kinetics of this reaction are, of course,
temperature dependent. The initial rate of increase in silicomolybdic acid,
and hence the ultimate absorbance, is quite
fast. By allowing the reaction to go closer
to completion the temperature-dependent kinetics become less important.
The laboratory temperature effect is
ca. 20 times less than the Armstrong et al. method formerly
used at OSU. A reviewer of an earlier draft of this manual stated that
methods using ascorbic acid or metol
as the reductant to silicomolybdic acid are not dependent
upon laboratory temperature. Because the effect appears to be caused by
the formation of silicomolybdic acid prior
to reduction, it would be difficult to understand
how this could be. This has not been checked at OSU. Some workers
choose to heat the sample stream after addition
of molybdic acid. This should also solve
the temperature dependence problem but at the cost of more added complexity
to the system.

8.4.1 Reagent Preparation:
Molybdic acid reagent for AA-II, SIO-ODF,
0.113 M in 0.74 M HCl.
8.4.1.1 Ammonium molybdate stock solution, 0.0405 M (5% w/v). Disolve 50 g (NH4)6Mo7O24 * 4H2O in 1000 ml DIW. This 5% molybdate stock solution is stable for several months if stored in a dark, air-tight bottle. If a white precipitate forms, the solution should be discarded and a fresh batch prepared.
8.4.1.2 Hydrochloric acid, 1.24M (10% v/v). Add 100 ml concentrated HCl to 800 ml DIW, mix, bring to 1000 ml, mix.
8.4.1.3 Molybdic acid reagent Mix 200 ml 5% ammonium molybdate stock solution with 300 ml 1.24 M HCl. Requirement: For AA-II, 230ml/ 24 hours.

8.4.1.4 Molybdic acid reagent for RFA and OSU AA-II, 0.061 M in 0.03 M sulfuric acid.Dissolve 10.8g ammonium molybdate, (NH4) 6 Mo7 O24 * 4H2O, in 1000 ml DIW containing 2.8ml concentrated H2 SO4 and 2.0ml 15% SLS per liter. Requirement: For AA-II, 900 ml; RFA, 555 ml/ 24 hours.
8.4.1.5 Tartaric Acid, 1.25 M (20% w/v) in DIW for both AA-II and RFA.Dissolve 200 g tartaric acid, HOCO(CHOH)2 COOH, in 950 ml DIW. Filter every ten days. Add one ml of reagent grade chloroform per 4 liters for preservation, refrigerate. Do not add too much chloroform; its solubility limit is ca. 0.6% in DIW; droplets of undissolved chloroform can cause noisy traces if they find their way to the flowcell. Requirement: AA-II, 470 ml/24 hours; RFA, 170 ml/24 hours.
8.4.1.6 Stannous Chloride
8.4.1.6.1 Hydrochloric acid, 6 M (50% v/v). Dilute 50 ml concentrate HCl to 100 ml with DIW, mix. The resulting concentration is only approximately 6 M but need not be more exact than this.
8.4.1.6.2 Stannous chloride stock solution, ca. 4.4 M (50% w/v) in ca. 6 M HCl. Dissolve 50g SnCl2 * 2H2O in 6 M HCl and make up to 100 ml with 6 M HCl. Store in a plastic bottle in a freezer at -10 C or below. If no freezer is available, store under mineral oil with a piece of mossy tin added. At freezer temperatures the solution is stable for one to two months.
8.4.1.6.3 Stannous chloride working solution, ca. 0.11 M (ca.1.1%) in 1.3 M HCl. Dilute 5 ml of stannous chloride stock solution to 200 ml with 1.2 M HCl. Make up fresh daily. Refrigerate whenever possible. A piece of mossy tin may be added. Requirement: AA-II, 150 ml/24 hours; RFA, 107 ml/24 hours.
8.4.1.6.4 SLS, 0.5M (15% w/v). Dissolve 15g sodium lauryl sulfate C12H25NaO4S) in 87ml DIW.
8.4.2 Reagent Notes.
8.4.2.1 The stannous chloride reagent deterioration can be very rapid and may cause an unstable baselines, poor peak shapes and, in case of total deterioration, no response at all. When experiencing these problems with the silicate analysis, this is the first place to look for the remedy.
8.4.2.2 Stannous chloride as purchased, or sometimes after prolonged storage, does not always dissolve completely. An insoluble white residue remains and the reagent is unfit for use. Therefore, all new batches or batches that have been stored for some time since last being used should be tested! SIO-ODF recommends use of anhydrous stannous chloride finding that it stores better than the dihydrate. This hasnt been checked at OSU.
8.4.2.3 Tin is not an environmentally friendly pollutant. Some in the nutrient analyzing community use more benign reagents. Ascorbic acid is used by some groups, metol by others; work at OSU indicates there are some disadvantages to using ascorbic acid and further work continues.
8.4.2.4 Again, care must be taken to monitor the silicic acid concentration of the DIW used for measuring the reagent blank for several days after leaving port (see Section 5.1).
9.0 Calculations.
The data processing described in this section consists of converting a set of voltage readings to concentrations of nutrients in the samples analyzed. The voltages read are analogs of optical absorbance of the sample streams flowing through the colorimeters. The two main steps are to correct the absorbance (voltage) data for a number of zero-offset errors, and to multiply the corrected absorbances by appropriate response factors, or "sensitivities," for the various analyzer channels. The zero-offset corrections include: (a) correction for nutrient impurities in the reagents and impurities in the reagents that behave like the nutrients in generating measurable color in the flow stream. This correction is termed the "reagent blank," (b) errors in the optics arising from the difference in refractive index between deionized water and seawater. This correction is the "refraction correction," (Atlas et al., 1971), and (c) the electronic and/or optical zero offset of the colorimeter/recorder system. This correction is made manually when adjusting the CFA colorimeters at the start of analysis and does not appear explicitly in the computations. (d) An error having a similar behavior arises from the contamination of a sample in the flow stream by a residuum of the previous sample. This is commonly called the "washout" or "carryover" error. This affects all sample, standard and blank measurements, to a greater or lesser degree depending upon the differences in concentrations of successive samples entering the flow stream. It is highly dependent upon the presence of poorly flushed "dead volumes" in the flow stream and upon the sheer length and complexity of the flow stream. Unfortunately this error is time dependent, often having characteristic times on the order on the residence time of one or a few samples in the flow colorimeter.
9.1 Reagent Blank Estimation.
Correction for the reagent blank depends upon a reliable source of a nutrient-free solution. Ideally, this would be nutrient-free natural seawater. However it is extremely difficult in practice to obtain or prepare nutrient-free seawater. Deionized water (DIW) is used instead. Sufficiently nutrient-free DIW is quite easy to prepare routinely and reliably at sea (see Section 4.2). NB. DIW prepared by ion exchange techniques can become contaminated by high levels of silicic acid in the fresh water supply. This can happen, and has too often happened, when ships take on fresh water in ports of call.
One measures the reagent blank by introducing two or more samples of DIW at the beginning and at the end of each batch of samples analyzed. In principle, the absorbance developed by these samples will result only from: a) the presence of nutrient impurities in the reagents, b) from the colorimeters optics and electronics (instrumental zero) and, c) nutrients present in the wash water introduced between samples.Thus, one can subtract the reagent blank absorbance from all the remaining samples and standards and arrive at the absorbance arising just from the nutrients contained in those standards and samples. But note that the instrument zero can drift measurably; experience shows that this drift is generally monotonic and linear with time.
Therefore the combined instrument zero and reagent blank absorbances (readings for DIW) are regressed upon position number in the batch being analyzed and interpolated values subtracted from all sample absorbances. They may also be subtracted from standard and standard matrix absorbances; in that case they cancel out upon taking differences to calculate response (or "sensitivity") factors as will be explained later. Note that it is not necessary to bring the output signals down to the reagent blank level between each pair of samples by prolonged "wash times!" When operating properly a CFA should not drift enough to make this necessary for the nutrient methods described here. Operation in this mode approximately doubles the analysis time; the result is more or less degeneration of the samples by bacterial activity and loss of operational efficiency. The only purpose of the intersample wash is to provide an easily detected mark between the output signals of adjacent samples!
9.2 Refraction Error Estimation.
The use of DIW to measure the reagent
blank corrections introduces a new source of error,
the refraction error (Atlas et al., 1971). It derives from the difference
in refractive indices of pure water
and seawater and the imperfect optics of the AutoAnalyzer or
RFA flow cell. (Were the end windows of the flow cell planar and parallel
to each other, the light beam perfectly
collimated and the flow cells inside diameter sufficiently larger
than the diameter of the light beam there would be no error from this
cause.) The measured "reagent blank" therefore
includes both the true reagent blank and
this refractive error.
To measure the refractive error itself
one first removes a critical reagent from each analyzer
flow stream, replacing the reagent with DIW. The critical reagent selected
is the one contributing least to the
total ionic strength of the stream and its total flow rate
and whose absence assures complete elimination of color development at
the wavelength of absorbance measurement.
Then, one passes a series of alternating DIW and natural seawater samples
through the system, records the absorbances and omputes
the refraction error, d, as the average difference with regard to sign.
At least ten differences should be
obtained.
where:
A = absorbance
n = number of differences between seawater and DIW peaks
DW = DIW
SW = seawater
9.3 Computation of Carryover Correction.
The carryover results from the finite
and more or less incomplete flushing of the flow system
between samples. Thus an error is present in any given absorbance reading.
Angelova and Holy (1983) have shown that the
carryover signal can be approximated as linearly dependent upon the difference
between the absorbance of a given sample
and that of the preceding sample for a linear system:
k = carryover coefficient
i = sample position number
A i = absorbance of the first full-scale standard
To correct a given absorbance reading,
Ai, one then adds the carryover correction:
A i,c = A i + o
where:
A i,c = corrected absorbance
The carryover coefficient, k, is obtained
for each channel by measuring the difference between
the absorbances of the second and first full-scale standards following
a near-zero standard or sample, all
having the same, natural seawater matrix composition. It
can equally well be calculated from the difference between the first two
near-zero standards following a full-scale
standard or sample. Measurement of the carry-over is
done in triplicate at the beginning of a cruise in order to obtain a statistically
significant number. It must be checked carefully
every time any change in plumbing of
a channel is done, including simple pump tube or coil replacement.
The formula for k is:
k = (A i+1 -A i)/(A
i -A i-1)
A i = Absorbance of the first full-scale standard
A i+1 = Absorbance of
the second full-scale standard
A i1 = Absorbance of the near-zero
standard preceding the first full-scale standard
Carryover corrections for well designed and maintained channels are usually less than 0.3%. The worst cases are for systems with large volumes such as those containing heating baths (phosphate) or debubblers (AA-II channels) or packed bed columns (the nitrate reduction column).
9.4 Calibration of analyzer response
The response of each analytical channel
per unit nutrient concentration is obtained by
addition of known nutrient concentrations to natural seawater and measuring
the resultant increases in absorbances.
Using natural seawater assures that systematic effects
(possible, unknown interferences) derived from natural seawater constituents
will be present in both the calibration standards
and seawater samples. However the natural
seawater used for this purpose will, in general, contain finite concentrations
of nutrients. It is not necessary that these
concentrations be zero, only low, thus, "low-nutrient
seawater" (LNSW). If the concentration were high to begin with, adding
sufficient additional nutrients to obtain
a usefully large signal might increase the total
nutrient concentration enough that the analyzer response becomes nonlinear.
In particular, this must be avoided
if linear formulae for data processing are used. Even when
nonlinear responses are corrected using nonlinear data processing techniques
application of the corrections can become
complicated if the matrix seawater contains appreciable
nutrient concentrations. (OSU protocols strive for a mid-range non-linearity
of no more than 0.4% in all analyses and use
a linear algorithm for data processing.
The SIO-ODF employs a nonlinear algorithm.) In general, LNSW is
acceptable if it contains less than ca. five
percent of full-scale concentrations of all the
nutrients. Given this condition the calibration procedure then consists
of measuring both the LNSW and the
LNSW with known additions of nutrients. The system response
to nutrient addition is computed from the slope of the "Beers Law" plot
of measured absorbance versus standard
additions to the matrix LNSW. Again, a non-linear fit
to this plot may be used. Other than
to correct the responses to the working standards for the nutrient content
of the matrix LNSW the signals from the LNSW
alone are of no intrinsic value. In some
situations theyre of value to monitor the DIW used for reagent blank measurement,
for example when contamination of shipboard
DIW occurs.
Calibration standards (at least in duplicate, preferably triplicate) must be placed at the beginning and end of each and every set of samples analyzed. Insert standards more often if the time required for a set exceeds one and a half hours. This time was selected on the basis of observed instrument response drift rates. Drifts in CFA response are usually linear and monotonic with time, similar to the situation with the zero offsets. The OSU data processing protocol regresses the observed beginning and ending response or "sensitivity factors" on sample number (counting blanks and standards as samples in this instance) and applies linearly interpolated "response factors" when computing concentrations. (Strictly speaking, the response factor as defined in the following equation is the reciprocal of sensitivity, hence the quotation marks.)
The response factors are computed from:
f = Ca / ( As - Am)
= response factor (or "sensitivity")
Ca = added concentration of nutrient in the calibration standard
As = absorbance of calibration standard
Am = absorbance of standard
matrix seawater (LNSW)
9.5.1 Correct all absorbances for carryover.
9.5.2 Regress the reagent blank absorbances against position number in the sample set and subtract the interpolated reagent blank from all absorbances. Strictly speaking, there is no need to do this for the calibration standard absorbances and their associated LNSW absorbances but there is no harm in doing so. It is simply easier to do it this way in most computer programs.
9.5.3 Subtract the refraction correction from all seawater sample absorbances.Again, there is no need to do this for the calibration standard and LNSW absorbances but it does no harm if done. This step produces fully corrected absorbances for all seawater samples.
9.5.4 Calculate the beginning and ending response factors, regress them against position number in the set and multiply sample absorbances by the interpolated values, giving the desired seawater concentrations. Some of these computations can be carried out in orders other than what is given here. Three important points to note here are, a) that this procedure gives correct results, b) that the analyst must thoroughly understand the concepts involved before making any changes in the procedure and c) that the analyst must compare the results obtained by the changed procedure with those resulting from this one and be certain they agree over a variety of conditions and concentration levels before accepting the new procedure.
9.6 Units for Expression of the Final Results and Conversion Factors: The concentra-tions resulting from the preceding calculations are micromolar, that is, micromoles per liter (mM or mmol * dm -3 ) of the nutrient ion. Expressing nutrient concentrations in these volumetric units makes them numerically dependent upon the ambient pres-sure experienced by the seawater sample. In order to be free of this pressure depen-dence many workers, chiefly those in geochemistry, choose the pressure independent units, mmol * kg -1 . To accomplish the numerical conversion it is necessary to know the density of the seawater samples at the time they are volumetrically drawn into the CFA pump and compared with the working standards whose concentrations are known in volumetric units. To do this one requires knowledge of the salinity of the samples and their temperature at analysis time. The salinities are generally known from the concomitant hydrographic observations. The sample temperatures closely enough approximate the laboratory temperature at the time the samples are analyzed. Fofonoff and Millard (1983) give a convenient algorithm for computing the density. The volumetric units are simply divided by the density to convert to pressure-independent gravimetric units.
9.7 Computer Software: The OSU group has developed a series of programs for nutrient data acquisition and processing. "DATABEEP," the first of these is a QuickBASIC program for control of a Keithley Instruments System500 data acquisition system in an IBM-PC type environment. It controls acquisition and digitization of the analog data from the flow colorimeters. It does this in "background" allowing the analyst to interact with DATABEEPs operational parameters in "foreground" to accomplish tasks like adjusting peak window delays and widths. DATABEEPs output is a raw, absorbance data file that can be edited and processed by the second program "NUT-CALC." NUTCALC, is also a QuickBASIC program. It carries out the computations described in this section in a menu-driven environment, operating upon an array of blank, standard and sample absorbances or voltage analogs. These can have been constructed by any digital data acquisition system including DATABEEP or by manually digitizing the data. It takes the raw data file through editing and processing steps to a new data file in concentration units. NUTCALC applies baseline and sensitivity drift (assumed linear and monotonic), applies carryover corrections, computes sensitivities (or calibration factors) and computes concentrations in micromolar units. Hydrographic and other bottle data can be entered into the nutrient data file, replicate samples averaged, sample depths entered, etc. Output from the program is in ASCII format.
NUTCALC and its companion programs including a multivariable plotting program are available on request from the authors at no cost.
10.0 Quality Assurance:
Quality assurance in nutrient analyses
as with any analytical procedure begins with well designed
and meticulously executed sampling methods. These have already been
described. The same must be said for the execution
of the actual analyses themselves. The analyst
must carefully monitor the performance of the CFA at all times, correcting
and noting any deviations from normal
and acceptable performance. It is imperative
that the analyst not continue operation of the CFA should its performance
not guarantee acceptably high quality data.
In such a case operation must be halted and the problem
corrected. Its obvious that a CFA can generate a distressingly large amount
of bad data in a short time if not
properly maintained and operated. A gap in a data set is far less
objectionable than a spate of bad data! Well
go through a plan of quality assurance steps that can facilitate producing
a good data set. This will include
a program of replicate sampling to provide a measure of short-term,
within laboratory precision, both for sampling
from the water column and for analysis of homogeneous
water samples by the CFA. Somewhat longer term precision can be
evaluated by examining consecutive station
agreement of deep samples and more rigorously
by examination of variance along isopycnal surfaces over not-too-long
horizontal distances.
10.1 Replicate sampling: Draw duplicate samples from two water samplers at each station. One pair is to be drawn from one of the deepest depths, another pair from the nitrate/phosphate maximum. Alternate the first with a mixed layer duplicate so that there is a good mix between low nutrient and high nutrient duplicates. The duplicates should be well separated in the sample tray and not placed in consecutive positions. As the cruise proceeds, maintain a cumulative log file of these replicate measurements.
10.2 Replicate analysis: For each stations set of samples, analyze two pairs of samples, selected in a manner similar to that in Section 10.1. Put seawater from each of the two sample bottles in two positions in the sampler tray. Again, the duplicates should be well separated in the sample tray and not placed in consecutive positions.
10.3 Quality checks during operation: Peak checking, offset detection. There are two gen-eral areas where the analyst must be diligent in maintaining quality assurance while operating the CFA and in the first steps of processing the data. First, the analyst must be conscientious to almost an extreme in constantly watching the flow characteristics of all channels of the CFA and monitoring the quality of the strip chart recorder traces. Second, if the data logging software implements an on-line computation and printout or display of root-mean-square noise on the sample peaks, the analyst must pay particular attention to abnormal variance and to correction of the cause.
10.4 Multivariate plotting of vertical profiles: As soon as possible following analysis of each station the analyst should construct a composite vertical profile plot of the nutrient data. Abnormal performance of water samplers and/or the CFA often show up as "flyers" in one or more of the nutrients. The nutrient analyst can often be the first person to notice the effects of a particular water sampler that habitually or often leaks. Sudden jumps in deep water concentrations observed upon overlaying subse-quent vertical profiles can alert the analyst to a problem with preparation of a work-ing or earlier stage calibration standard or with an unstable standard.
10.5 Use of the WHPEDIT program: The WHPEDIT program developed by the WOCE Hydrographic Program (WHP) Office serves as a highly sensitive device for the detection of flyers and offsets in the nutrient and other data. We heartily endorse its use. Further, the data originators in the WHP program, including the nutrient data originators, are responsible for the first round of assigning data quality flags to the data. WHPEDIT has been expressly designed to assist with this process and makes the process much easier for the analyst than entering data quality flags into the WHP data format by hand.
10.6 Comparison with historical data: If the analysts have time at sea and if adequate historical data are available overlaying plots of the current data with the historical data is an excellent quality assurance technique. Care must be taken that the historical data are, in fact, of quality adequate for the purpose!
11.0 References
Angelova, S., and H.W. Holy. 1983. Optimal
speed as a function of system performance for
continuous flow analyzers. Analytica Chimica Acta 145: 51-58.
Armstrong, F. A. J., C. R. Stearns, and
J. D. H. Strickland. 1967. The measurement of upwelling
and subsequent biological processes by means of the Technicon AutoAnalyzer
and associated equipment. Deep-Sea Res. 14(3): 381-389.
Atlas, E. L., S. W. Hager, L. I. Gordon
and P. K. Park. 1971. A practical manual for use of the
Technicon Autoanalyzer in seawater nutrient analyses; revised. Technical
Report 215. Oregon State University,
Dept. of Oceanography, Ref. No. 71-22. 48 pp.
Bernhardt, H. and A. Wilhelms. 1967. The
continuous determination of low level iron, soluble
phosphate and total phosphate with the AutoAnalyzer. Technicon Symp., 1967,
Vol. I, p. 386.
Chapman, P. and S.A. Mostert. 1990. Does
freezing of nutrient samples cause analytical errors?
S. Afr. J. Mar. Sci. 9:239-247.
Fofonoff, N.P., and R.C. Millard, Jr.
1983. Algorithms for computation of fundamental properties
of seawater. UNESCO technical papers in marine science 44, UNESCO. 53
pp.
Gilmartin, M. 1967. Changes in inorganic
phosphate concentration occurring during seawater
sample storage. Limnol. Oceanogr. 12: 325-328.
Garside, C. 1993. Nitrate reductor efficiency
as a source of analytical error. Marine Chemistry,
submitted.
Gordon, L.I., J.M. Krest and A.A. Ross.
in preparation. Continuous Flow Analysis of silicic
acid in seawater: Reducing sensitivity to laboratory temperature fluctuations.
Grasshoff, K., M. Ehrhardt, K. Kremling.
1983. Methods of seawater analysis. 2nd. ref. ed.
Verlag Chemie GmbH, Weinheim. 419 pp.
Group of Technical Experts on Nutrient
Analysis for the WOCE Hydrographic Program. 1989.
Unpublished minutes.
Hager, S. W., L. I. Gordon and P. K. Park.
1968. A practical manual for use of the Technicon
AutoAnalyzer in seawater nutrient analyses. Final report to Bureau of
Commercial Fisheries, Contract 14-17-0001-1759.
Oregon State University, Dept. of Oceanography,
Ref. No. 68-33. 31 pp.
Joyce, T., C. Corry and M. Stalcup, eds.
1991. Requirements for WOCE Hydrographic Programme
data reporting. WHPO Publication 90-1 Revision 1. Woods Hole Programme
Office, Woods Hole Oceanographic Institution. WOCE Report 67/91.
UNPUBLISHED MANUSCRIPT. 71 pp.
Kolthoff, I.M., E.B. Sandell, E.J. Meehan
and S. Bruckenstein. 1969. Quantitative Chemical
Analysis, 4th ed., Macmillan, London. 1199 pp.
Macdonald, R.W., F.A. McLaughlin and C.S.
Wong. 1986. The storage of reactive silicate samples
by freezing. Limnol. Oceanogr. 31(5):1139-1142. Mostert,
S.A. 1988. Notes on improvements and modifications to the automatic methods
for determining dissolved micronutrients in
seawater. S. Afr. J. Mar. Sci. 7:295-298. U.S.
WOCE Office. 1989. U.S. WOCE Implementation Plan, U.S. WOCE Implementation
Report Number 1. College Station, TX. 176
pp.
Weast, R.C., M.J. Astle and W.H. Beyer,
eds. 1985. CRC Handbook of Chemistry and Physics.
66th. edition.
Weiss, R.F., W.S. Broecker, H. Craig and
D. Spencer. 1983. GEOSECS Indian Ocean Expedition,
Vol. 5, Hydrographic Data, 1977-1978. 48 pp.
Wood, E. D., F. A. J. Armstrong, and F.
A. Richards. 1967. Determination of nitrate in seawater
by cadmium-copper reduction to nitrite. J. Mar. Biol. Assoc. U. K. 47(1):
23- 31.