NDP-097 (2018)
NCEI Accession 0173932 Data and Documentation Files
Autonomous seawater partial pressure of carbon dioxide (pCO2) and pH time series from 40 surface buoys between 2004 and 2017 (NCEI Accession 0173932)
Adrienne J. Sutton1, Richard A. Feely1, Stacy Maenner-Jones1, Sylvia Musielewicz1,2, John Osborne1,2, Colin Dietrich1,2, Natalie Monacci3, Jessica Cross1, Randy Bott1, Alex Kozyr4
Prepared by Alex Kozyr4
1Pacific Marine Environmental Laboratory, National Oceanic and Atmospheric Administration, Seattle, Washington, USA
2Joint Institute for the Study of the Atmosphere and Ocean, University of Washington, Seattle, Washington, USA
3Ocean Acidification Research Center, University of Alaska Fairbanks, Fairbanks, Alaska, USA
4National Centers for Environmental Information, National Oceanic and Atmospheric Administration, Silver Spring, Maryland, USA

Abstract
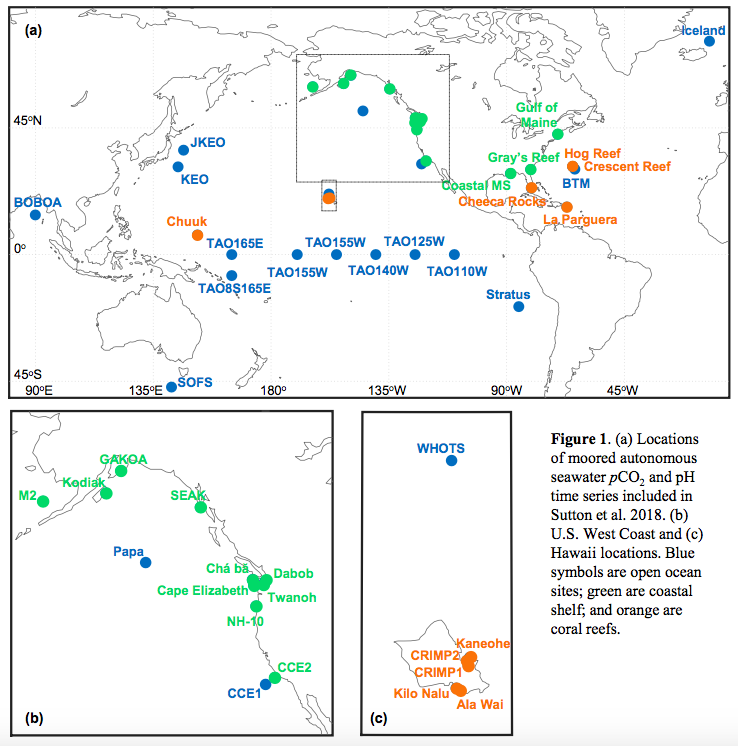
Ship-based time series, some now approaching over three decades long, are critical climate records that have dramatically improved our ability to characterize natural and anthropogenic drivers of ocean CO2 uptake and biogeochemical processes. Advancements in autonomous ocean carbon observing technology over the last two decades have led to the expansion of fixed time series stations with the added capability of characterizing sub-seasonal variability. Here we present a data product of 40 autonomous moored surface ocean pCO2 (partial pressure of CO2) and pH time series measurements between 2004 and 2017. These time series characterize a wide range of seawater pCO2 and pH conditions in different oceanic (17 sites) and coastal (12 sites) regimes including coral reefs (11 sites). With well-constrained daily to interannual variability and an estimate of decadal variability, these data suggest the length of time series necessary to detect an anthropogenic trend in seawater pCO2 and pH varies from 8 to 15 years at the open ocean sites, 16 to 41 years at the coastal sites, and 9 to 22 years at the coral reef sites. Only two open ocean pCO2 time series, WHOTS in the subtropical North Pacific and Stratus in the South Pacific gyre, are longer than the estimated time of emergence, and deseasoned monthly means show anthropogenic trends of 1.9±0.3 μatm yr-1 and 1.6±0.3 μatm yr-1, respectively. In the future, it is possible that updates to this product will allow for estimating anthropogenic trends at more sites; however, the product currently provides a valuable tool in an accessible format for evaluating climatology and natural variability of surface ocean carbonate chemistry in a variety of regions. Data are available at https://www.nodc.noaa.gov/ocads/data/0173932.xml
Further details are inSutton, et al. 2019
Table 1. Data access to deployment-level archived data files at NCEI and the time series data product for each moored buoy location. The earliest date of seawater pCO2 trend emergence is calculated by adding the time of emergence (ToE) estimate to the time series start year (see Sutton, et al. 2019 for more details). NA denotes sites lacking enough observations for estimating ToE.
aDiscontinued sites where a long-term trend cannot be quantified from this time series data product.
bLinks to NCEI archived deployment-level data files are provided for both MOSEAN and WHOTS; however, these time series are combined in the time series data product.
Sutton, Adrienne J.; Feely, Richard A.; Maenner Jones, Stacy; Musielewicz, Sylvia; Osborne, John; Dietrich, Colin; Monacci, Natalie M.; Cross, Jessica N.; Bott, Randy; Kozyr, Alex (2018). Autonomous seawater partial pressure of carbon dioxide (pCO2) and pH time series from 40 surface buoys between 2004 and 2017 (NCEI Accession 0173932). Version 1.1. NOAA National Centers for Environmental Information. Dataset. https://doi.org/10.7289/V5DB8043..
